
Abstract
Objective
The use of neoadjuvant chemotherapy (NAC) has improved outcomes in breast cancer (BC). The residual cancer burden index (RCB) predicts prognosis. This study evaluated RCB as a prognosticator in BC subtypes treated with NAC.
Materials and Methods
A retrospective cohort of BC patients was analyzed. Five-year distant recurrence-free survival (DRFS), disease-free survival (DFS), and overall survival (OS) were analyzed. Statistical analyses included descriptive statistics, ANOVA, chi-square test, Fisher’s exact test, Kaplan-Meier curves, Log-Rank test, and Cox regression.
Results
Among 562 women, RCB correlated with BC subtypes and predicted worse DRFS, DFS, and OS. In stratified analyses by molecular subtype, the association was significant only for luminal B and triple-negative subtypes, with inconsistent findings for luminal A and human epidermal growth factor type 2-overexpressed subtypes.
Conclusion
The RCB index was shown to be a prognostic marker in BC in a Brazilian population with BC. Significant associations were found only for the luminal B and triple negative subtypes. Further research is required to investigate the prognostic utility of RCB in other larger populations.
Keywords: Breast cancer, breast cancer subtypes, neoadjuvant chemotherapy, immunohistochemistry, prognosis
Key Points
• The residual cancer burden (RCB) index predicts outcomes in breast cancer treated with neoadjuvant chemotherapy; notable for luminal B and triple negative breast cancer (TNBC).
• RCB-III shows poor prognosis across breast cancer subtypes, with up to a five-fold increased risk.
• Luminal B and TNBC show significant survival differences when stratified by RCB class.
• RCB index as a continuous variable forecasts distant recurrence, progression, and death.
• The present study confirms the prognostic value of RCB index in a Brazilian cohort with breast cancer but there is a need for futher subtype-specific research.
Introduction
Breast cancer (BC) is considered a systemic disease () and a significant public health issue. This is the most common cancer type and responsible for the highest cancer mortality rates among women (). Significant changes in the understanding of tumor biology and BC treatment have taken place from the end of the 20th century. Treatment has evolved from initial surgical approach with the aim of locoregional disease control into multidisciplinary management with the introduction of systemic therapy, leading to significant improvements in disease-free survival (DFS) and overall survival (OS) (, ).
The National Surgical Adjuvant Breast and Bowel Project studies, B-18 (, ) and B-27 (), initiated a new era in the treatment of BC and demonstrated other benefits when employing neoadjuvant chemotherapy (NAC). These include the greater possibility of being able to use conservative surgery and evaluating in vivo treatment responses based on tumor responses (-).
The achievement of pathological complete response (pCR) with the use of NAC has been associated with increased survival rates (-). Given this evidence, this treatment has been validated as a reliable prognostic marker (). The use of an index that, through post-NAC pathological criteria, is capable of predicting the chance of disease progression and death within 5 years makes it possible to evaluate the prognosis in patients undergoing this type of initial BC treatment. The residual cancer burden (RCB) Index stratifies patients with BC undergoing NAC into four groups; the RCB Index has demonstrated differences in distant recurrence-free survival (DRFS), DFS and OS, providing more precise information and facilitating strategic indications concerning adjuvant therapies (-).
There is a lack of studies from Latin America, and especially from Brazil, that demonstrate the usefulness of this index in clinical practice. This is important as there are marked differences in demographic and epidemiological population characteristics from those observed on other continents (). Thus, the aim of the present study was to evaluate the prognostic power of the RCB Index in a cohort of patients with BC undergoing NAC at the Brazilian National Cancer Institute (INCA).
Materials and Methods
Study Design and Location
This study comprises a retrospective cohort investigation of patients with BC followed at the Cancer Hospital III, part of the (HCIII/INCA), located in the city of Rio de Janeiro, where around 1000 treatments are provided each year for BC. The study was approved by the INCA Human Research Ethics Committee under opinion 166.838, following resolution 466/12 of the National Health Council of the Ministry of Health (date: 04.01.2013).
Eligibility Criteria
Female patients with a histopathologically-confirmed diagnosis of BC, of any ages and with clinical staging (CS) T1-4, N0-3 and M0 and having undergone initial NAC-based treatment were included in the study. Those who did not complete NAC or who required changes to the planned NAC regimen were excluded. Patients in whom data was not sufficient to make RCB calculations (bidimensional tumor bed, % total cellularity, % in situ cellularity, number of positive lymph nodes and the size of the largest metastasis), had no molecular subtype specified [incomplete or no data regarding estrogen receptor, progesterone receptor, human epidermal growth factor type 2 receptor (HER-2) and Ki-67 level], or who were pregnant at diagnosis, as well as those presenting with bilateral breast carcinoma, clinical and/or cardiological contraindications to the use of chemotherapy, non-epithelial tumors, a history of previous breast carcinoma and, finally, those classified as metastatic (M1) in the imaging evaluation but were then classified as non-metastatic in the initial clinical evaluation were excluded.
Participant Selection
Initially, a total of 935 women, presenting between 2013 and 2015, were selected from the Hospital Cancer Registry. This period was chosen to allow a sufficient follow-up period of at least 5 years in order to properly analyze the study outcomes. After applying the eligibility criteria, 562 patients were included ().
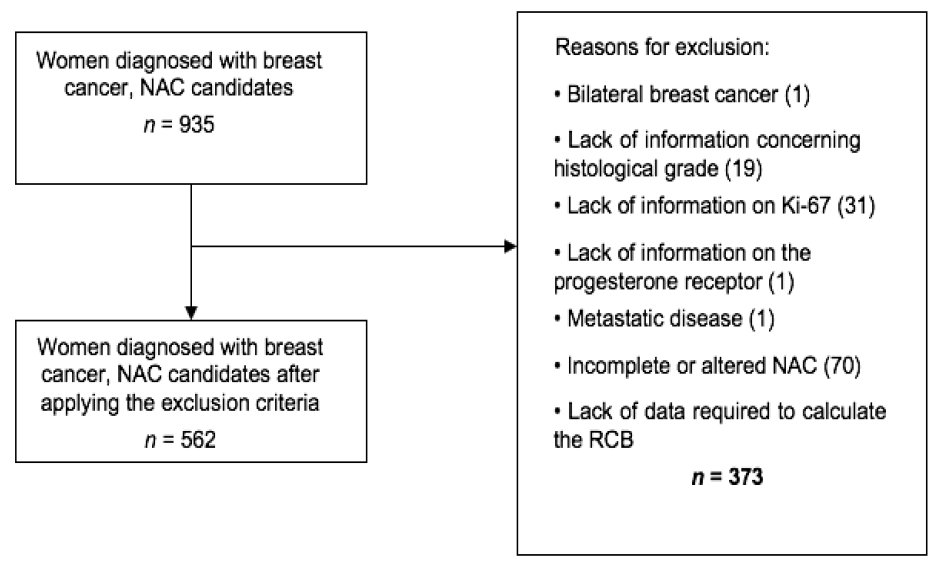
NAC: Neoadjuvant chemotherapy; RCB Residual cancer burden
Sociodemographic, clinical, tumor, treatment and follow-up data (recurrence, metastasis and death) were obtained from electronic and physical records.
All patients underwent the same institutional treatment routine according to CS and molecular tumor profile determined by immunohistochemistry.
RCB Index and RCB Class Calculations
The RCB index was calculated as a continuous variable, based on information obtained from the histopathological reports of the assessed surgical specimens, through data concerning the primary tumor bed (two-dimensional tumor bed, % global cellularity and % in situ disease) and lymph nodes (number of positive lymph nodes and diameter of the largest metastasis) ().
The determination of global cellularity in the histopathological reports followed the INCA/HCIII Pathology Service standards, based on the sum of the cellularity of the invasive portion and the cellularity of the in situ portion.
This data was then used to calculate the RCB index using the formula RCB = 1.4 (finvdprim)0.17 + [4(1–0.75LN)dmet]0.17. The originally proposed cutoff points were applied for the data interpretation, resulting in four RCB classes, which indicate the progressive residual volume of disease, as follows: RCB-0 (RCB = 0, equivalent to pCR); RCB-1 (score >0–1.36), RCB-2 (score 1.37–3.28) and RCB-3 (score >3.28) (). A random sample of 50 patients was included in the calculator (available at http://www3.mdanderson.org/app/medcalc/index.cfm?pagename=jsconvert3) to validate the spreadsheet formula, obtaining a 100% agreement rate.
The absence of invasive breast and axilla carcinomas (pT0/pTis and pN0) was assumed to be pCR.
Study Outcomes
To evaluate the prognostic power of the RCB index, a 5-year DRFS was proposed as the primary outcome, defined as the interval in months between the initial BC diagnosis and distant recurrence [Symmans et al. (), 2007]. Secondary outcomes comprised DFS and 5-year OS. The DFS was considered as the time interval in months between the pathological diagnosis and the appearance of a second primary tumor, recurrence of invasive or non-invasive disease, or death. The OS was considered as the period in months between the pathological diagnosis and the occurrence of death from any cause. Time was censored at the end of follow-up, on the date of the last institutional consultation (lost to follow-up) or December 31, 2020, the date the study ended.
Statistical Analyses
The descriptive statistics of the categorical variables are presented in tables, depicting their absolute and relative frequency distributions, while continuous variables are presented as central tendency measures (means and standard deviations). An analysis of variance (ANOVA) was applied to compare continuous variables, and associations between categorical variables, were verified by Pearson’s chi-square test and Fisher’s exact test, when indicated.
The DRFS, DFS and OS curves for the total population and each molecular subtype were constructed employing the Kaplan-Meier method and compared using the Log-Rank test. All survival curves were expressed as percentages versus time (in months).
Cox proportional hazards regression models (univariate and multiple) were used to explore the risk of distant progression, recurrence, or death according to RCB classes and the RCB index was used as a continuous variable.
Variables whose statistical significance in Cox univariate analyses exhibited p<0.15 values were inserted into a multiple model built sequentially using the Stepwise Forward method, beginning with the variable most strongly associated with the outcome and continuing until no other variable reached significance (). Variables presenting with p<0.05 were maintained in the final model. All statistical analyses were performed using the Statistical Package for the Social Science (SPSS) for Windows, version 24 (IBM Inc., Armonk, NY, USA).
Results
Study Population Characteristics
Data from the 562 patients included and presenting with the following molecular profiles were analyzed: 16.7% luminal A, 52.3% luminal B, 9.6% overexpressed HER2 and 21.4% triple negative breast cancer (TNBC). Mean patient age was 51.3±11.4 years old. Of the patients, 34.2% were Caucasian and 51.4% were menopausal. The predominant CS was III (53.2%), with 59.2% grade 1 or 2 and 92.3% of the histological findings indicated non-special type invasive carcinoma (CI-TNE). A total of 81.7% of all patients underwent mastectomies and 78.4%, axillary lymphadenectomies, while 97.5% underwent chemotherapy regimens based on anthracyclines and taxanes ().
Table 1. Clinical characteristics of the whole study population and when stratified by molecular breast cancer subtypes at diagnosis
Pre-NAC variables | Total | Luminal A | Luminal B | Overexpressed HER2 | Triple negative | p |
|---|---|---|---|---|---|---|
n (%) | n (%) | n (%) | n (%) | n (%) | ||
562 (100.0) | 94 (16.7) | 294 (52.3) | 54 (9.6) | 120 (21.4) | ||
Age (years), mean (± SD) | 51.3 (11.4) | 52.7 (11.1) | 51.4 (11) | 50.5 (11.6) | 50.0 (12.5) | 0.294a |
Race/skin color | - | |||||
White | 192 (34.2) | 26 (27.7) | 98 (33.3) | 23 (42.6) | 45 (37.5) | 0.452* |
Non-white | 367 (65.3) | 68 (72.3) | 194 (66.0) | 31 (57.4) | 74 (61.7) | |
Missing | 3 (0.5) | 0 (0.0) | 2 (0.7) | 0 (0.0) | 1 (0.8) | |
Menopausal status | - | |||||
Pre-menopausal (≤50 years old) | 273 (48.6) | 42 (44.7) | 143 (48.6) | 28 (51.9) | 60 (50.0) | 0.825 |
Post-menopausal (>50 years old) | 289 (51.4) | 52 (55.3) | 151 (51.4) | 26 (48.1) | 60 (50.0) | |
Tumor size (T) | - | |||||
T1/2 | 203 (36.1) | 45 (47.9) | 95 (32.3) | 25 (46.3) | 38 (31.6) | 0.05 |
T3 | 167 (29.7) | 22 (23.4) | 88 (29.9) | 16 (29.6) | 41 (34.2) | |
T4 | 192 (34.2) | 27 (28.7) | 111 (37.8) | 13 (24.1) | 41 (34.2) | |
Lymph nodes (N) | - | |||||
N0 | 252 (44.8) | 52 (55.3) | 132 (44.9) | 21 (38.9) | 47 (39.2) | 0.192 |
N1 | 240 (42.7) | 31 (33.0) | 129 (43.9) | 27 (50.0) | 53 (44.2) | |
N2/ N3 | 70 (12.5) | 11 (11.7) | 33 (11.2) | 6 (11.1) | 20 (16.6) | |
Histological grade | - | |||||
1 or 2 | 389 (69.2) | 90 (95.7) | 230 (78.2) | 26 (48.1) | 43 (35.8) | 0.001* |
3 | 164 (29.2) | 4 (4.3) | 62 (21.1) | 26 (48.1) | 72 (60.0) | |
Missing | 9 (1.6) | 0 (0.0) | 2 (0.7) | 2 (3.8) | 5 (4.2) | |
Clinical staging | - | |||||
I/ II | 263 (46.8) | 54 (57.4) | 130 (44.2) | 29 (53.7) | 50 (41.7) | 0.062 |
III | 299 (53.2) | 40 (42.6) | 164 (55.8) | 25 (46.3) | 70 (58.3) | |
Breast surgery | - | |||||
Breast conserving | 103 (18.3) | 14 (14.9) | 56 (19.0) | 7 (13.0) | 26 (21.7) | 0.428 |
Mastectomy | 459 (81.7) | 80 (85.1) | 238 (81.0) | 47 (87.0) | 94 (78.3) | |
Axillary surgery | - | |||||
Sentinel lymph node biopsy (SLNB) | 121 (21.5) | 22 (23.4) | 62 (21.1) | 13 (24.1) | 24 (20.0) | 0.933 |
Axillary lymph node dissection (ALND) | 388 (69.0) | 63 (67.0) | 201 (68.4) | 37 (68.5) | 87 (72.5) | |
SLNB + ALND | 53 (9.5) | 9 (9.6) | 31 (10.5) | 4 (7.4) | 9 (7.5) | |
Neoadjuvant regimen | - | |||||
Anthracyclic + Taxane | 548 (97.5) | 93 (98.9) | 289 (98.3) | 52 (96.3) | 114 (95.0) | 0.173 |
Other | 14 (2.5) | 1 (1.1) | 5 (1.7) | 2 (3.7) | 6 (5.0) | |
SD: Standard deviation; NAC: Neoadjuvant chemotherapy; HER: Human epidermal growth factor receptor-type 2; a: p-value obtained by an ANOVA analysis; *: p-value obtained by Fisher’s exact test; Other p values calculated using the Pearson chi-square test; in bold, p<0.05
Following NAC, the following distribution was observed between RCB classes: 12.1% pCR, 6.4% RCB-I, 51.1% RCB-II and 30.4% RCB-III. Furthermore, 11.9% still presented ypT3/T4 tumors and 40.2%, positive axilla. The post-treatment variables (RCB classes, ypT and ypN) were significantly different between the total population and the molecular BC subtypes ().
Table 2. Characteristics of the whole study population and when stratified by molecular breast cancer subtypes by IHC following neoadjuvant chemotherapy
Pre-NAC variables | Total | Luminal A | Luminal B | Overexpressed HER2 | Triple negative | p |
|---|---|---|---|---|---|---|
n (%) | n (%) | n (%) | n (%) | n (%) | ||
562 (100.0) | 94 (16.7) | 294 (52.3) | 54 (9.6) | 120 (21.4) | ||
RCB classes | - | |||||
0 | 68 (12.1) | 2 (2.1) | 20 (6.8) | 15 (27.8) | 31 (25.8) | 0.001 |
I | 36 (6.4) | 1 (1.1) | 25 (8.5) | 4 (7.4) | 6 (5.0) | |
II | 287 (51.1) | 57 (60.6) | 149 (50.7) | 28 (51.8) | 53 (44.2) | |
III | 171 (30.4) | 34 (36.2) | 100 (34.0) | 7 (13.0) | 30 (25.0) | |
YpT | - | |||||
PCR | 105 (18.7) | 5 (5.3) | 45 (15.3) | 23 (42.6) | 32 (26.7) | 0.001* |
ypT1 | 193 (34.3) | 30 (31.9) | 115 (39.1) | 17 (31.5) | 31 (25.8) | |
ypT2 | 197 (35.1) | 48 (51.1) | 99 (33.7) | 11 (20.4) | 39 (32.5) | |
ypT3/T4 | 67 (11.9) | 11 (11.7) | 35 (11.9) | 3 (5.5) | 18 (15.0) | |
YpN | - | |||||
ypN0 | 336 (59.8) | 47 (50.0) | 163 (55.4) | 42 (77.8) | 84 (70.0) | 0.001* |
ypN1 | 124 (22.1) | 30 (31.9) | 62 (21.1) | 9 (16.7) | 23 (19.2) | |
ypN2/3 | 102 (18.1) | 17 (18.1) | 69 (23.5) | 3 (5.5) | 13 (10.8) | |
SD: Standard deviation; NAC: Neoadjuvant chemotherapy; IHC: Immunohistochemistry; HER: Human epidermal growth factor receptor-type 2; RCB: Residual cancer burden; *: p-value obtained by Fisher’s exact test; other p values calculated by Pearson’s chi-square test; in bold, p<0.05
Survival Analysis
displays the calculated DRFS, DFS and OS percentages at 5 years per RCB class, both for the total population and for each molecular BC profile. Similar survival rates were observed between patients with pCR and those with RCB-I. However, RCB-II and RCB-III patients displayed progressively lower survival rates, with more evident differences in the most aggressive tumors (overexpressed HER2 and TNBC).
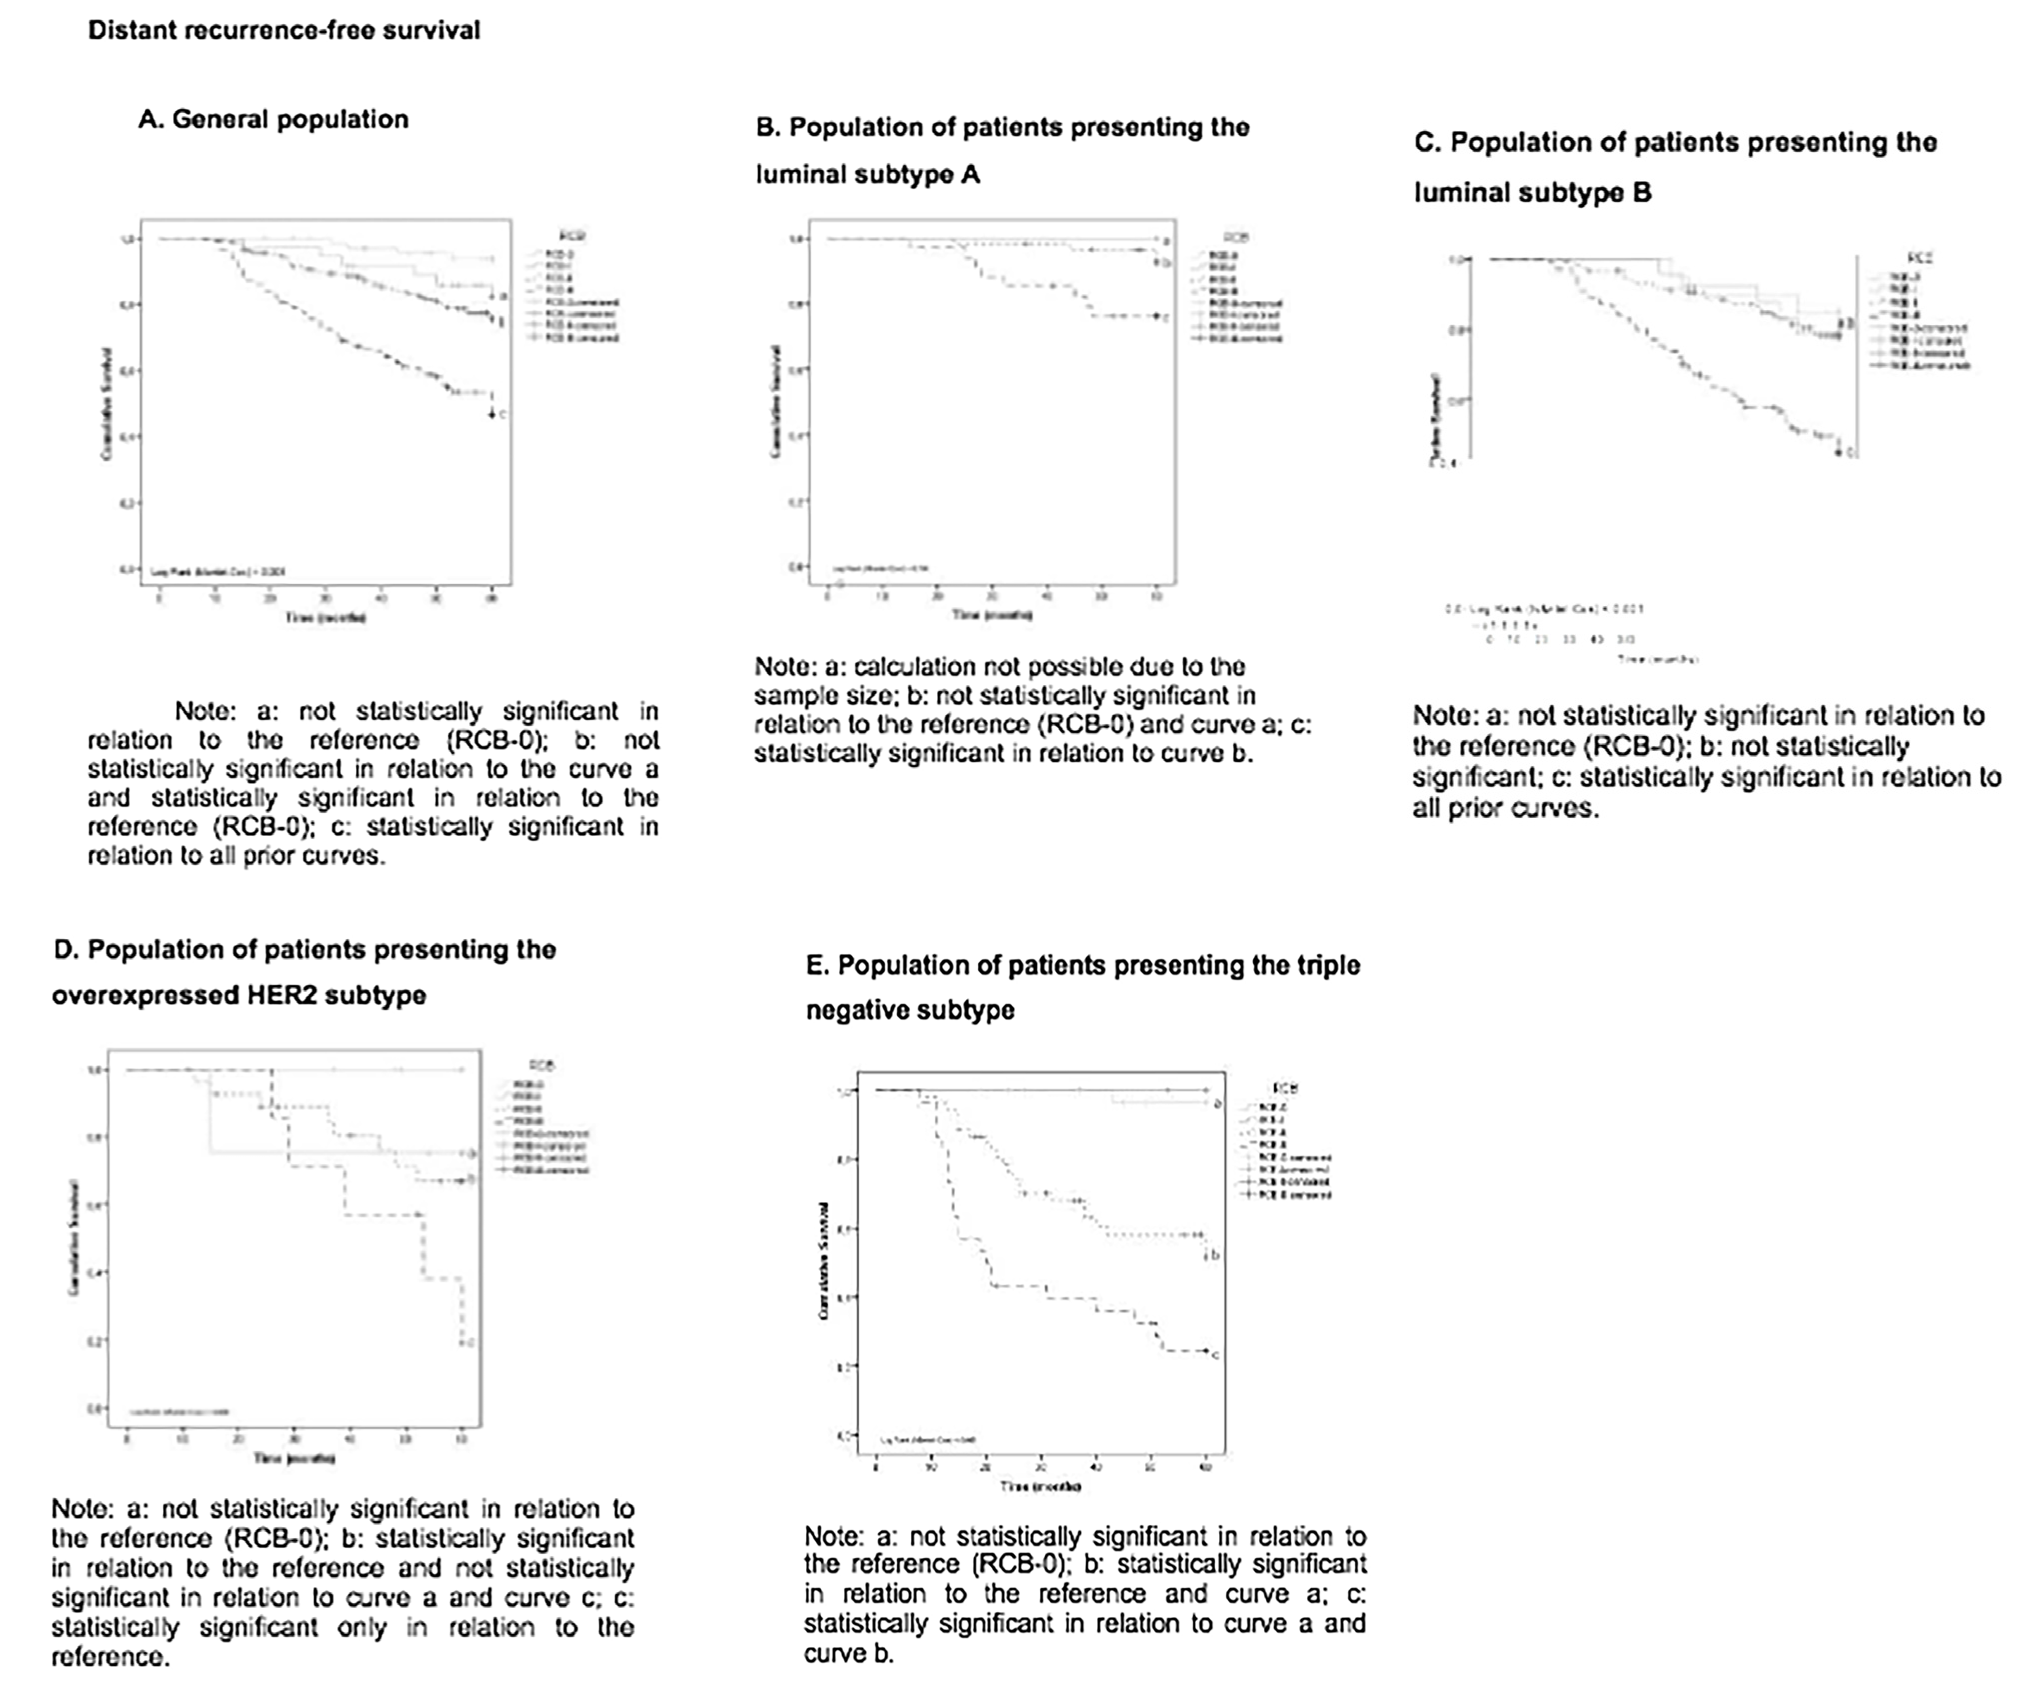
The Kaplan-Meier curves for DRFS, DFS and OS according to each RCB class are depicted in and . A significant difference (p<0.001) was observed when comparing the RCB classes for all survival curves in the total study population (SF 1A, and ). Concerning patients with luminal A tumors, the survival curves (SF 1B, and ) did not indicate significant differences when comparing RCB classes, while a significant difference in relation to the RCB classes was observed in all survival curves for those with luminal B tumors (SF 1C, and ) (p<0.001). No difference in OS was observed in patients with overexpressed HER2 tumors () in relation to RCB class differences, while a significant difference was observed for DRFS and DFS (SF 1D, ). The survival curves (SF 1E, and J) for patients presenting with TNBC tumors also exhibited differences in survival metrics depending on the RCB class.
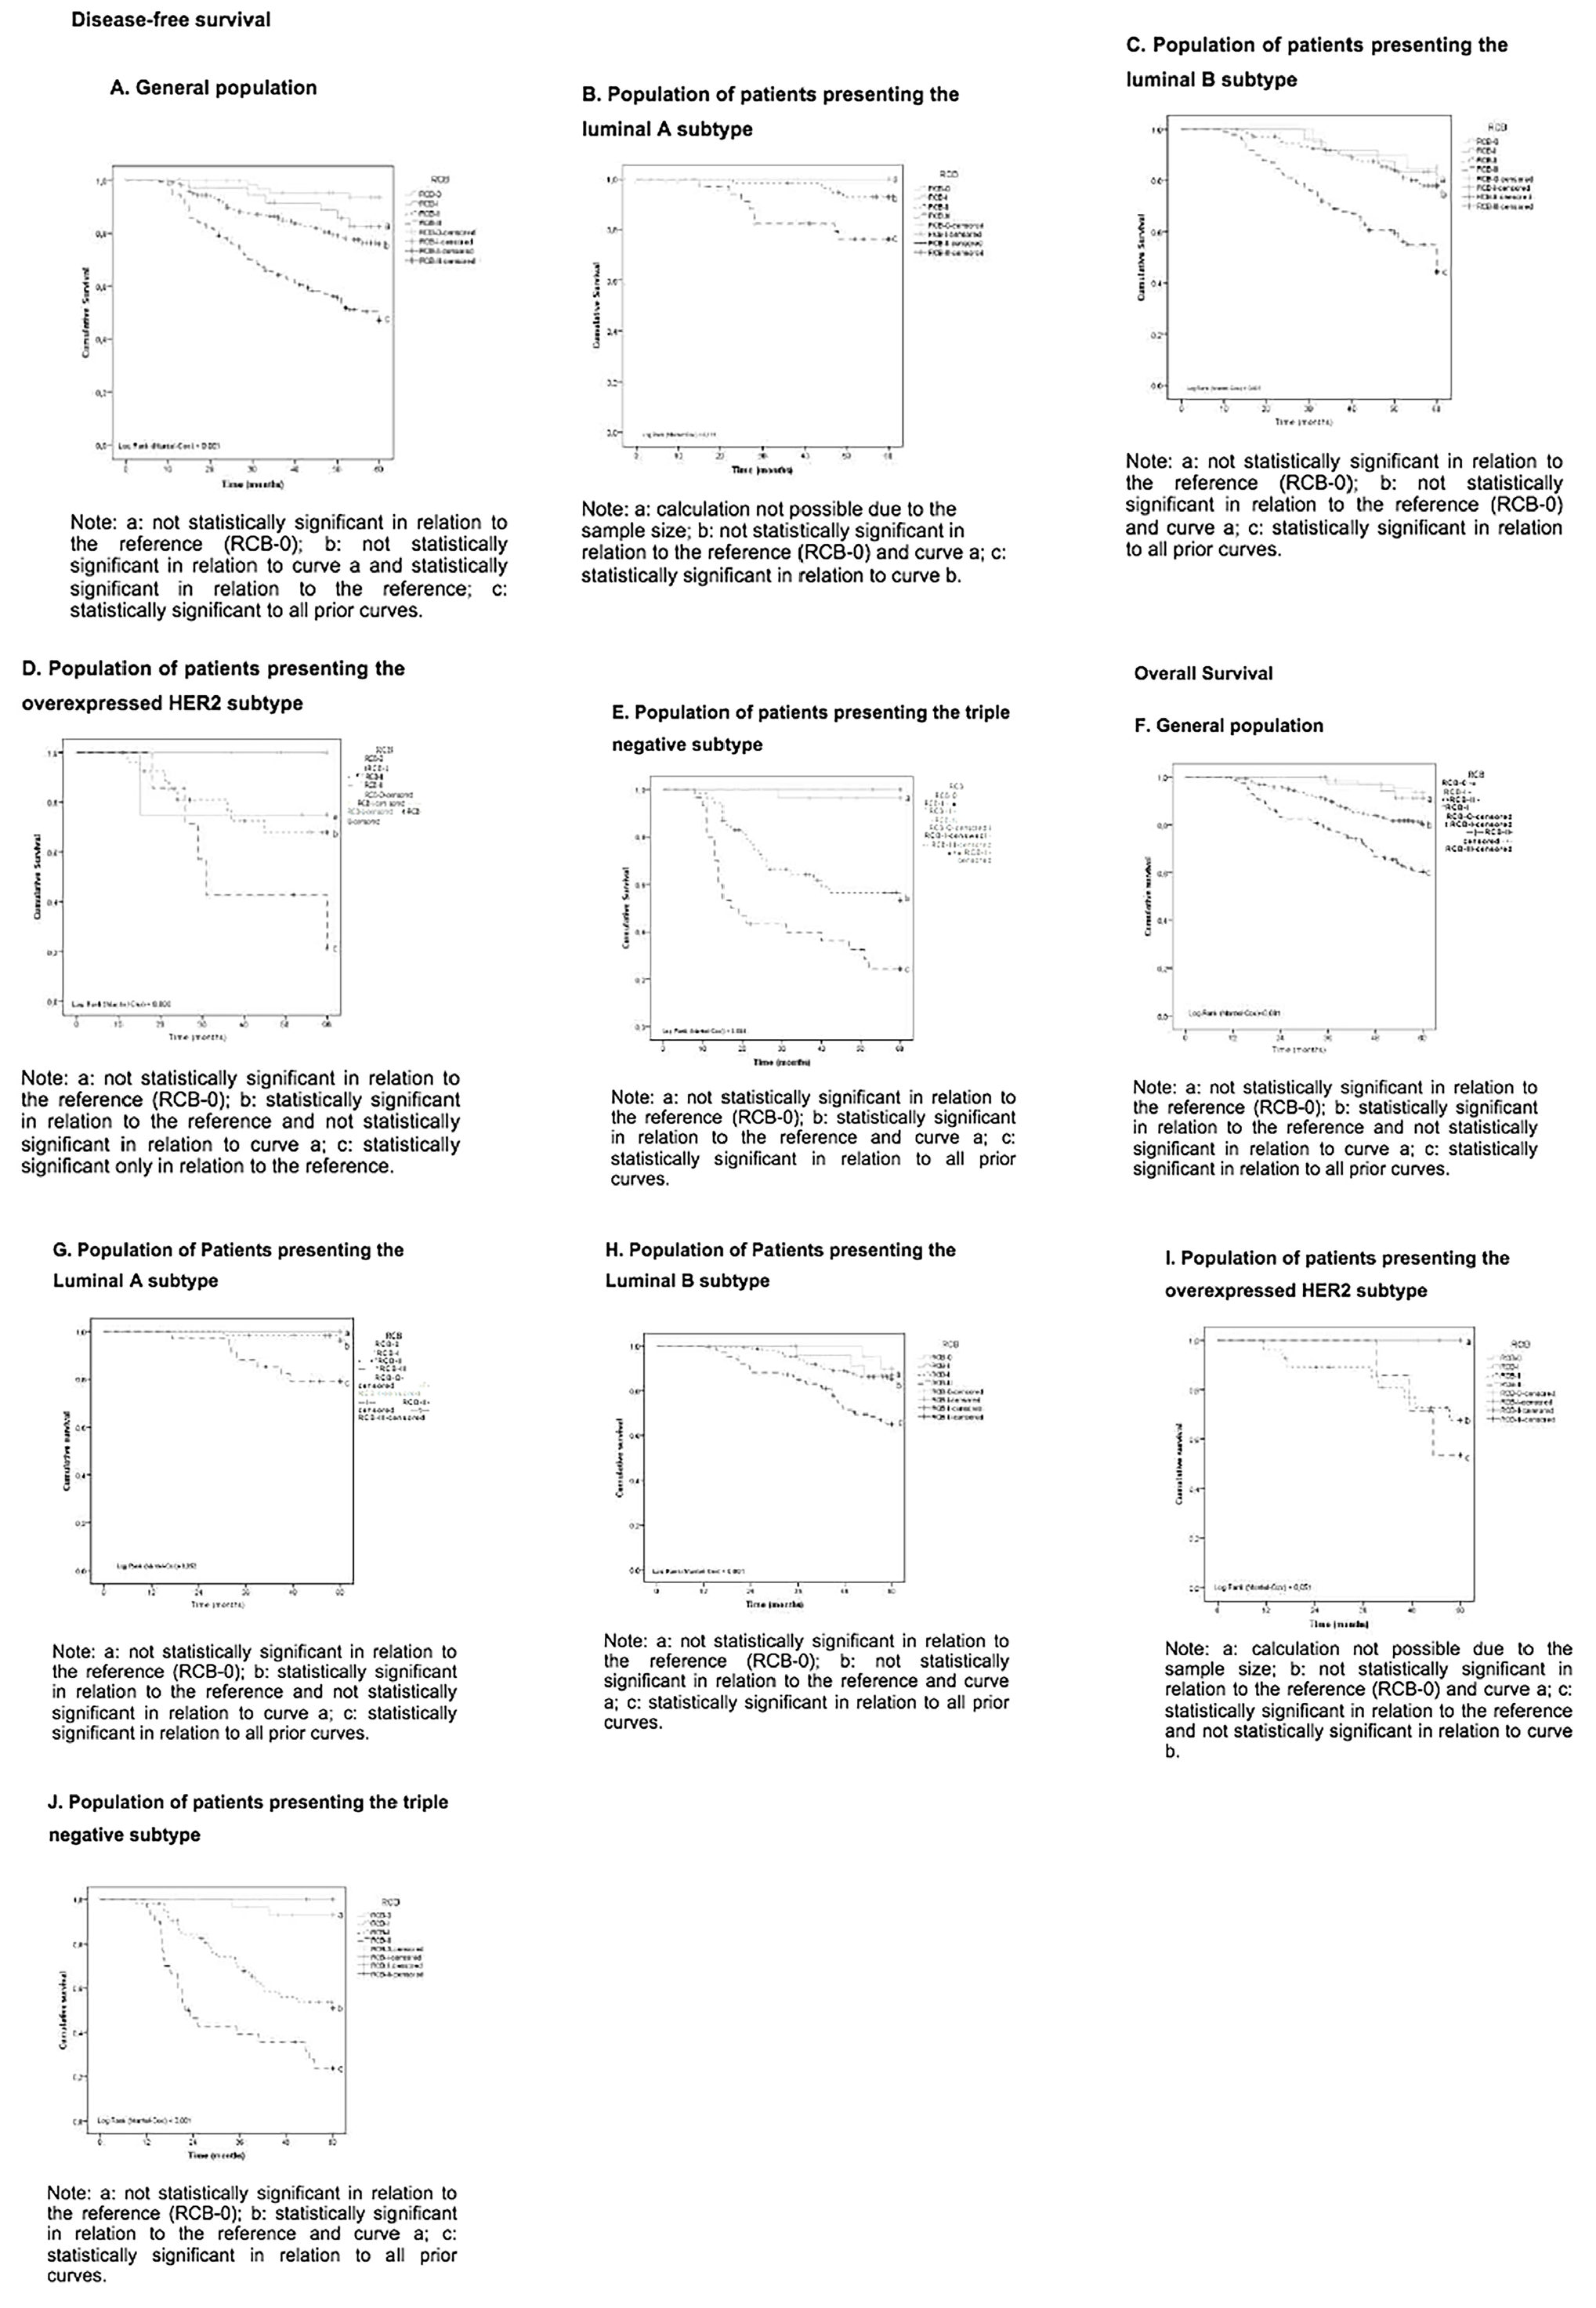
RCB: Residual cancer burden; HER2: Human epidermal growth factor receptor 2
Risk Assessment According to the RCB Index and RCB Classes
Univariate Cox regression analyses were performed () to determine the risk of progression, recurrence, and death in the study population. Age and menopausal status were not significant in any of the analyses, nor was any difference between the RCB-0 and RCB-I classes detected.
In the general population, the adjusted Cox analysis indicated a gradual increase in the risk of DRFS, DFS and OS with increasing RCB Indices (). Increases of 70, 80 and 70% were also observed concerning the risk of distant recurrence, recurrence or progression or death, respectively, with each 1-point score increase when the RCB index was used as a continuous variable.
Table 3. Crude and adjusted Cox analysis according to RCB classes and RCB index in the whole study population and molecular breast cancer subtypes by immunhistochemistry regarding distant recurrence-free survival
- | cHR (95% CI) | p | aHR (95% CI) | p |
|---|---|---|---|---|
Whole study population* (n = 562) | ||||
RCB classes | ||||
0 (n = 68) | Ref. | - | Ref. | - |
I (n = 36) | 2.9 (0.8–10.4) | 0.096 | 3.1 (0.9–10.8) | 0.085 |
II (n = 287) | 4.3 (1.6–11.8) | 0.005 | 4.3 (1.6–11.7) | 0.005 |
III (n = 171) | 11.7 (4.3–31.8) | <0.001 | 10.9 (3.9–29.6) | <0.001 |
RCB index (as a continuous variable) | 1.9 (1.6–2.2) | <0.001 | 1.7 (1.1–2.5) | <0.001 |
Luminal A*** (n = 94) | ||||
RCB classes | ||||
0 (n = 2) | Ref. | - | Ref. | - |
I (n = 1) | £ | £ | £ | £ |
II (n = 57) | £ | £ | £ | £ |
III (n = 34) | £ | £ | £ | £ |
RCB index (as a continuous variable) | 2.6 (1.3–5.2) | 0.008 | 2.6 (1.3–5.2) | 0.008 |
Luminal B (n = 294) | ||||
RCB classes | ||||
0 (n = 20) | Ref. | - | Ref. | - |
I (n = 25) | 1.4 (0.4–6.0) | 0.627 | 1.5 (0.4–6.1) | 0.616 |
II (n = 149) | 1.5 (0.5–5.0) | 0.493 | 1.5 (0.5–4.9) | 0.516 |
III (n = 100) | 4.8 (1.5–15.5) | 0.008 | 4.5 (1.4–14.4) | 0.012 |
RCB index (as a continuous variable)*** | 1.8 (1.5–2.2) | <0.001 | 1.8 (1.5–2.2) | <0.001 |
Overexpressed HER2*** (n = 54) | ||||
RCB classes | ||||
0 (n = 15) | Ref. | - | Ref. | - |
I (n = 4) | £ | 0.914 | £ | £ |
II (n = 28) | £ | 0.912 | £ | £ |
III (n = 7) | £ | 0.904 | £ | £ |
RCB index (as a continuous variable) | 2.2 (1.5–3.3) | <0.001 | 2.2 (1.5–3.3) | <0.001 |
Triple negative*** (n = 120) | ||||
RCB classes | ||||
0 (n = 31) | Ref. | - | Ref. | - |
I (n = 6) | 2.9 (0.8–10.4) | 0.096 | 2.9 (0.8–10.4) | 0.096 |
II (n = 53) | 4.3 (1.6–11.8) | 0.005 | 4.3 (1.6–11.8) | 0.005 |
III (n = 30) | 11.7 (4.3–31.8) | <0.001 | 11.7 (4.3–31.8) | <0.001 |
RCB index (as a continuous variable) | 2.0 (1.6–2.5) | <0.001 | 2.0 (1.6–2.5) | <0.001 |
CI: Confidence interval; CS: Clinical staging; HER: Human epidermal growth factor receptor-type 2; RCB: Residual cancer burden; cHR: Crude hazard ratio; aHR: Adjusted hazard ratio. In bold, p<0.05; adjusted by: *T; **CS and ***without adjustment variables; £: Insufficient sample size for the calculation
Table 4. Crude and adjusted Cox analysis according to RCB classes and RCB index in the whole study population and for molecular breast cancer subtypes regarding disease-free survival
- | cHR (95% CI) | p | aHR (95% CI) | p |
|---|---|---|---|---|
Whole study population (n = 562) | ||||
RCB classes* | ||||
0 (n = 68) | Ref. | - | Ref. | - |
I (n = 36) | 2.9 (0.8–10.3) | 0.099 | 3.0 (0.9–10.6) | 0.092 |
II (n = 287) | 4.3 (1.6–11.9) | 0.005 | 4.1 (1.5–11.2) | 0.007 |
III (n = 171) | 11.8 (4.3–32.0) | <0.001 | 7.0 (2.2–21.7) | 0.001 |
RCB index (as a continuous variable)** | 1.9 (1.6–2.2) | <0.001 | 1.8 (1.6–2.1) | <0.001 |
Luminal Aa (n = 94) | ||||
RCB classes | ||||
0 (n = 2) | Ref. | - | Ref. | - |
I (n = 1) | £ | £ | £ | £ |
II (n = 57) | £ | £ | £ | £ |
III (n=34) | £ | £ | £ | £ |
RCB index (as a continuous variable) | 2.6 (1.3–5.2) | 0.008 | 2.6 (1.3–5.2) | 0.008 |
Luminal B (n = 294) | ||||
RCB classes*** | ||||
0 (n = 20) | Ref. | - | Ref. | - |
I (n = 25) | 1.4 (0.4–6.0) | 0.632 | 1.5 (0.4–6.0) | 0.618 |
II (n = 149) | 1.5 (0.5–5.0) | 0.495 | 1.5 (0.5–4.9) | 0.511 |
III (n = 100) | 5.0 (1.6–15.9) | 0.007 | 4.6 (1.5–14.7) | 0.01 |
RCB index (as a continuous variable)a | 1.8 (1.5–2.2) | <0.001 | 1.8 (1.5–2.2) | <0.001 |
Overexpressed HER2 (n = 54) | ||||
Classes de RCB | ||||
0 (n = 15) | Ref. | - | Ref. | - |
I (n = 4) | £ | 0.914 | £ | £ |
II (n = 28) | £ | 0.912 | £ | £ |
III (n = 7) | £ | 0.904 | £ | £ |
RCB index (as a continuous variable) | 2.2 (1.5–3.3) | <0.001 | 2.2 (1.5–3.3) | <0.001 |
Triple negative (n = 120) | ||||
Classes de RCB**** | ||||
0 (n = 31) | Ref. | - | Ref. | - |
I (n = 6) | £ | 0.975 | £ | 0.978 |
II (n = 53) | 17.0 (2.3–126.3) | 0.006 | 19.3 (2.6–144.2) | 0.004 |
III (n = 30) | 41.7 (5.6–309.7) | <0.001 | 14.1 (1.5–136.5) | 0.022 |
RCB index (as a continuous variable)a | 2.0 (1.6–2.3) | <0.001 | 2.0 (1.6–2.3) | <0.001 |
CI: Confidence interval; CS: Clinical staging; HER: Human epidermal growth factor receptor-type 2; RCB: Residual cancer burden; cHR: Crude hazard ratio; aHR: Adjusted hazard ratio. In bold, p<0.05; adjusted by: *ypN and T; **T; ***CS and ****ypN and awith no adjustment variables; £: Insufficient sample size for the calculation
Table 5. Crude and adjusted Cox analysis according to RCB classes and RCB index in the whole study population and for molecular breast cancer subtypes regarding overall survival
- | cHR (95% CI) | p | aHR (95% CI) | p |
|---|---|---|---|---|
Whole study population (n = 562) | ||||
RCB classesa | ||||
0 (n = 68) | Ref. | - | Ref. | - |
I (n =36) | 1.4 (0.3–6.3) | 0.655 | 1.5 (0.3–6.5) | 0.632 |
II (n = 287) | 3.5 (1.3–9.7) | 0.015 | 3.4 (1.3–9.5) | 0.018 |
III (n = 171) | 8.1 (2.9–22.1) | <0.001 | 7.2 (2.6–19.8) | <0.001 |
RCB index (as a continuous variable)b | 1.8 (1.5–2.1) | <0.001 | 1.7 (1.5–2.0) | <0.001 |
Luminal A*** (n = 94) | ||||
RCB classes | ||||
0 (n = 2) | Ref. | - | Ref. | - |
I (n = 1) | £ | £ | £ | £ |
II (n = 57) | £ | £ | £ | £ |
III (n = 34) | £ | £ | £ | £ |
RCB index (as a continuous variable) | 5.2 (1.7–16.0) | 0.004 | 5.2 (1.7–16.0) | 0.004 |
Luminal B (n = 294) | ||||
RCB classes*** | ||||
0 (n = 20) | Ref. | - | Ref. | - |
I (n = 25) | 1.3 (0.2–7.8) | 0.768 | 1.3 (0.2–7.8) | 0.768 |
II (n = 149) | 1.6 (0.4–6.7) | 0.542 | 1.6 (0.4–6.7) | 0.542 |
III (n = 100) | 4.2 (1.0–17.8) | 0.046 | 4.2 (1.0–17.8) | 0.046 |
RCB index (as a continuous variable)c | 1.7 (1.3–2.1) | <0.001 | 1.7 (1.3–2.1) | <0.001 |
overexpressed HER2*** (n = 54) | ||||
RCB classes | ||||
0 (n = 15) | Ref. | - | Ref. | - |
I (n = 4) | 1.0 (*) | 1 | £ | £ |
II (n = 28) | £ | 0.941 | £ | £ |
III (n = 7) | £ | 0.939 | £ | £ |
RCB index (as a continuous variable) | 1.8 (1.2–2.8) | 0.008 | 1.8 (1.2–2.8) | 0.008 |
Triple negative (n = 120) | ||||
RCB classesd | ||||
0 (n = 31) | Ref. | - | Ref | - |
I (n = 6) | £ | 0.981 | £ | 0.976 |
II (n = 53) | 9.0 (2.1–38.2) | 0.003 | 10.3 (2.3–45.4) | 0.002 |
III (n = 30) | 21.6 (5.1–91.9) | <0.001 | 6.3 (1.1–37.9) | 0.044 |
RCB index (as a continuous variable)*** | 2.0 (1.6–2.5) | <0.001 | 2.0 (1.6–2.5) | <0.001 |
CI: Confidence interval; RE: Estroger receptor; ypN: Pathological axilla; HER: Human epidermal growth factor receptor-type 2; RCB: Residual cancer burden; cHR: Crude hazard ratio; aHR: Adjusted hazard ratio. In bold, p<0.05; adjusted by: aT; T and bKi-67; cRE and Ki-67; dypN and T and ***without adjustment variables; £: Insufficient sample size for the calculation
The risks associated different RCB classes could not be calculated for patients with luminal A tumors, as no data convergence was obtained. However, when used as a continuous variable, the RCB index indicated increases of about two-fold, 2.6-fold and 5.2-fold concerning the risk of distant recurrence, recurrence or progression or death for each 1-point score increase, respectively ().
In patients with luminal B tumors, the risk of DRFS, DFS and OS associated with the RCB classes increased by 4.5-fold, 4.6-fold and 4.2-fold, respectively, for RCB-III. When used as a continuous variable, the RCB index indicated an almost two-fold increase in the risk of distant recurrence, recurrence or progression or death for each 1-point score increase ().
Risks associated with different RCB classes for patients with overexpressed HER-2 tumors could not be calculated, again due to a lack of data convergence. On the other hand, when the RCB index was employed as a continuous variable, a two-fold increase in the risk of distant recurrence, recurrence or progression or death was noted with each 1-point score increase (p<0.001) ().
Finally, RCB classes exhibited independent prognostic value regarding the risk of distant recurrence, recurrence or progression and death in patients with TNBC, while an increasing risk as the RCB index increased was noted only for DRFS. The risk of distant recurrence, recurrence or progression or death increased two-fold (p<0.001) for each 1-point score RCB index increase ().
Discussion and Conclusion
This study included 562 BC patients with more than half with luminal B subtype, just over a fifth with TNBC and smaller proportions of luminal A and HER2. As the predominant CS was advanced (53.2%), most patients underwent radical surgery (81.7% mastectomies and 78.4% axillary lymphadenectomies). The most commonly used chemotherapy regimen was based on anthracyclines and taxanes (97.5%).
The survival curves analysis for the whole cohort and by molecular subtype indicated that patients of all subgroups with minimal residual disease (RD) (RCB-I) exhibit a similar prognosis at 5 years to those who achieved pCR (RCB-0). Conversely, those with extensive RD (RCB-III) exhibited a poor prognosis. Patients with an RCB-II classification, around 50% of the population, remain in need of additional investigations.
The RBC index analyzed as a continuous variable was associated with the prognosis of BC across the whole study population and in all molecular subtypes. However, when analyzed by class, this association was detected only in the total population and in patients with the luminal B and TNBC subtypes, probably due to the small sample size noted for the other profiles.
Concerning the total population, as well as in the study conducted by Hamy et al. () and in contrast to Symmans et al. (), age and menopausal status did not exhibit statistically significant differences between the assessed molecular BC subtypes in both the univariate and multiple analyses. The inclusion criteria of the present study allowed for the study of patients presenting with T4, N2 and N3, similar to the study conducted by Gomes da Cunha et al. (), who evaluated the Brazilian population, and differing from the original study carried out by Symmans et al. () and replicated by several other authors, such as Hamy et al. () and Yau et al. (). Thus, patients presenting with more advanced CS than in the initial studies were included, with a predominance of CS III, positive hormone receptors, negative HER2, elevated Ki-67 and grades 1 and 2. The applied Kaplan-Meier analysis highlighted the significant drop in DRFS, DFS and OS with increasing RCB class and when the RCB index was analyzed as a continuous variable (p<0.001). The multiple analysis demonstrated an increase in the risk of distant progression, recurrence, and death by about two-fold for each 1-point increase in the RCB index (p<0.001), adjusted for T and Ki-67. The RCB II and III classes adjusted for T and ypN were also significantly associated with these survival parameters.
The Kaplan-Meier analyses did not indicate significant differences between RCB classes for patients with luminal A subtype. The multiple regression analysis indicated an increase in the risk of distant progression and recurrence by about 2.6-fold for each 1point increase in the continuous score, as well as an increase in the risk of death by more than five times with a one-point score increase. Such findings corroborate the results reported by Yau et al. (), the only study demonstrating an increased risk among tumors classified as luminal and in contrast to the currently available literature.
Concerning patients with luminal B subtype, the Kaplan-Meier analyses demonstrated a significant difference between RCB classes. The multiple analysis demonstrated an increase in the risk of distant progression, recurrence and death of around two-fold for each 1-point increase in the continuous score, and when adjusted by estrogen receptor and Ki-67, only for the risk of death. The RCB class analysis for this subtype verified a significant prognostic association in RCB-III equivalent to pathological stage III, in contrast to the findings of Symmans et al. (), probably due to the inclusion of patients with TNBC tumors in our study. These findings are, however, in line with the more recent results reported by Yau et al. ().
With regard to patients with overexpressed HER2 BC, the Kaplan-Meier analyses only indicated a lack of differences between classes regarding OS. The multiple analysis indicated an increase in the risk of distant progression, recurrence, and death by about two-fold for each 1-point increase in the continuous score without adjustment, similar to Symmans et al. () and Yau et al. ().
Finally, regarding women with TNBC, the Kaplan-Meier analyses verified a significant difference between RCB classes (p<0.001). The multiple analysis demonstrated an increase in the risk of distant progression, recurrence, and death of approximately double for each 1-point increase in the continuous score, again without adjustment. In the current study, RCB classes for patients with TNBC were prognosticators in RCB-II and RCB-III tumors, equivalent to pathological staging II and III, and similar to that reported by Symmans et al. (), Hamy et al. () and Yau et al. ().
This study, therefore, corroborates the founding results reported by Symmans et al. (), Symmnas et al. (), Hamy et al. () and Yau et al. (), with an increase in the chance of distant BC progression with increasing RCB scores in the whole study population and in sub-groups with some different molecular BC subtypes, as well as with the risk of recurrence and death.
The survival analyses confirm the findings reported by Symmans et al. (), Hamy et al. () and Yau et al. (), indicating better survival rates in patients without RD or with minimal RD and differences between molecular BC subtypes, with lower survival rates among patients with more aggressive BC.
As reported by Symmans et al. () and Romero et al. (), positive axilla in the present study were inversely associated with DRFS. Similarly, some patients who achieved pCR following NAC evolved to recurrence or disease progression, indicating that they remained at risk of disease progression despite good responses.
Study Limitations
This study’s limitations include that it was a retrospective analysis, employing data from a single institution, with anatomopathological reports prepared by multiple pathologists. Furthermore, different chemotherapy regimens could not be assessed, as carried out by Symmans et al. () and Symmans et al. (), as almost all patients (97.5%) underwent an anthracycline and taxane-based regimen. Moreover, the number of patients in the RCB classes for the luminal A and overexpressed HER-2 subtypes was insufficient to estimate specific DRFS, DFS and OS. Retrospectively obtaining the RCB did not interfere with its discriminatory power, and all patients were subjected to the same institutional routine. However, this is, to the best of our knowledge, the largest study to include patients treated in the Brazilian Unified Health System (SUS). Despite having mostly advanced CS, similar survival rates was detected, similar to the earlier studies, reinforcing previous findings and expanding the use of this tool the population served in the Brazilian SUS (, , , -).
The RCB index displayed predictive power when used as a continuous variable, comprising an independent prognostic factor for predicting distant progression, recurrence or death following NAC in the whole study population and in all molecular BC subtypes. The RCB classes in patients with luminal B subtype indicated a 4 to 5-fold increase in the risk of distant progression, recurrence, and death, which was significant only in RCB-III. In patients with TNBC, RCB classes demonstrated a 4 to 20-fold increase in the risk of distant progression, recurrence, and death, which was significant for RCB-II and RCB-III. Further investigations into the utility of RCB Index in the prognosis of patients with the luminal A and overexpressed HER-2 subtypes is required as the present study was unable to definitively demonstrate this, probably due to smaller subgroup sizes.
Footnotes
Ethics
Ethics Committee Approval: The study was approved by the INCA Human Research Ethics Committee under opinion 166.838, following resolution 466/12 of the National Health Council of the Ministry of Health (date: 04.01.2013).
Informed Consent: Retrospective study.
Authorship Contributions
Surgical and Medical Practices: E.N.A.V., A.B., M.A.B., L.C.S.T.; Concept: E.N.A.V., A.B., M.A.B., L.C.S.T.; Design: E.N.A.V., A.B., M.A.B., L.C.S.T.; Data Collection or Processing: E.N.A.V., A.B., M.A.B.; Analysis or Interpretation: E.N.A.V., A.B., M.A.B., L.C.S.T.; Literature Search: E.N.A.V., A.B., M.A.B., L.C.S.T.; Writing: E.N.A.V., A.B., M.A.B., L.C.S.T.
Conflict of Interest: No conflict of interest was declared by the authors.
Financial Disclosure: The authors declared that this study received no financial support.
References
Christian MC, McCabe MS, Korn EL, Abrams JS, Kaplan RS, Friedman MA. The National Cancer Institute audit of the National Surgical Adjuvant Breast and Bowel Project Protocol B-06. N Engl J Med. 1995; 333: 1469-1474. (PMID: 7477148)
Ferlay J, Ervik M, Lam F, Colombet M, Mery L, Piñeros M, et al. Global Cancer Observatory: Cancer Today. Lyon: International Agency for Research on Cancer; 2020. Available link: https://gco.iarc.fr/today/en?utm_source=chatgpt.com
Early Breast Cancer Trialists' Collaborative Group. Systemic treatment of early breast cancer by hormonal, cytotoxic, or immune therapy. 133 randomised trials involving 31,000 recurrences and 24,000 deaths among 75,000 women. Early Breast Cancer Trialists’ Collaborative Group. Lancet. 1992; 339: 1-15. (PMID: 1345950)
Ahmed MI, Lennard TW. Breast cancer: role of neoadjuvant therapy. Int J Surg. 2009; 7: 416-420. (PMID: 19524705)
Fisher B, Brown A, Mamounas E, Wieand S, Robidoux A, Margolese RG, et al. Effect of preoperative chemotherapy on local-regional disease in women with operable breast cancer: findings from National Surgical Adjuvant Breast and Bowel Project B-18. J Clin Oncol. 1997; 15: 2483-2493. (PMID: 9215816)
Wolmark N, Wang J, Mamounas E, Bryant J, Fisher B. Preoperative chemotherapy in patients with operable breast cancer: nine-year results from National Surgical Adjuvant Breast and Bowel Project B-18. J Natl Cancer Inst Monogr. 2001; : 96-102. (PMID: 11773300)
Mamounas EP. NSABP protocol B-27. Preoperative doxorubicin plus cyclophosphamide followed by preoperative or postoperative docetaxel. Oncology (Williston Park). 1997; 11(6 Suppl 6): 37-40. (PMID: 9213327)
Chevallier B, Roche H, Olivier JP, Chollet P, Hurteloup P. Inflammatory breast cancer. Pilot study of intensive induction chemotherapy (FEC-HD) results in a high histologic response rate. Am J Clin Oncol. 1993; 16: 223-228. (PMID: 8338056)
Fisher B, Bryant J, Wolmark N, Mamounas E, Brown A, Fisher ER, et al. Effect of preoperative chemotherapy on the outcome of women with operable breast cancer. J Clin Oncol. 1998; 16: 2672-2685. (PMID: 9704717)
Kuerer HM, Newman LA, Smith TL, Ames FC, Hunt KK, Dhingra K, et al. Clinical course of breast cancer patients with complete pathologic primary tumor and axillary lymph node response to doxorubicin-based neoadjuvant chemotherapy. J Clin Oncol. 1999; 17: 460-469. (PMID: 10080586)
Kaufmann M, Hortobagyi GN, Goldhirsch A, Scholl S, Makris A, Valagussa P, et al. Recommendations from an international expert panel on the use of neoadjuvant (primary) systemic treatment of operable breast cancer: an update. J Clin Oncol. 2006; 24: 1940-1949. Erratum in: J Clin Oncol. 2006; 24: 3221. (PMID: 16622270)
Guarneri V, Broglio K, Kau SW, Cristofanilli M, Buzdar AU, Valero V, et al. Prognostic value of pathologic complete response after primary chemotherapy in relation to hormone receptor status and other factors. J Clin Oncol. 2006; 24: 1037-1044. (PMID: 16505422)
Berry DA, Cirrincione C, Henderson IC, Citron ML, Budman DR, Goldstein LJ, et al. Estrogen-receptor status and outcomes of modern chemotherapy for patients with node-positive breast cancer. JAMA. 2006; 295: 1658-1667. Erratum in: JAMA. 2006; 295: 2356. (PMID: 16609087)
Cortazar P, Zhang L, Untch M, Mehta K, Costantino JP, Wolmark N, et al. Pathological complete response and long-term clinical benefit in breast cancer: the CTNeoBC pooled analysis. Lancet. 2014; 384: 164-172. Erratum in: Lancet. 2019; 393: 986. (PMID: 24529560)
Peintinger F, Sinn B, Hatzis C, Albarracin C, Downs-Kelly E, Morkowski J, et al. Reproducibility of residual cancer burden for prognostic assessment of breast cancer after neoadjuvant chemotherapy. Mod Pathol. 2015; 28: 913-920. (PMID: 25932963)
Spring LM, Fell G, Arfe A, Sharma C, Greenup R, Reynolds KL, et al. Pathologic complete response after neoadjuvant chemotherapy and impact on breast cancer recurrence and survival: a comprehensive meta-analysis. Clin Cancer Res. 2020; 26: 2838-2848. (PMID: 32046998)
Boughey JC, Alvarado MD, Lancaster RB, Fraser Symmans W, Mukhtar R, Wong JM, et al. Surgical standards for management of the axilla in breast cancer clinical trials with pathological complete response endpoint. NPJ Breast Cancer. 2018; 4: 26. Erratum in: NPJ Breast Cancer. 2019; 5: 2. (PMID: 30131975)
Symmans WF, Peintinger F, Hatzis C, Rajan R, Kuerer H, Valero V, et al. Measurement of residual breast cancer burden to predict survival after neoadjuvant chemotherapy. J Clin Oncol. 2007; 25: 4414-4422. (PMID: 17785706)
Symmans WF, Wei C, Gould R, Yu X, Zhang Y, Liu M, et al. Long-term prognostic risk after neoadjuvant chemotherapy associated with residual cancer burden and breast cancer subtype. J Clin Oncol. 2017; 35: 1049-1060. (PMID: 28135148)
Masuda N, Lee SJ, Ohtani S, Im YH, Lee ES, Yokota I, et al. Adjuvant capecitabine for breast cancer after preoperative chemotherapy. N Engl J Med. 2017; 376: 2147-2159. (PMID: 28564564)
von Minckwitz G, Huang CS, Mano MS, Loibl S, Mamounas EP, Untch M, et al. Trastuzumab emtansine for residual invasive HER2-positive breast cancer. N Engl J Med. 2019; 380: 617-628. (PMID: 30516102)
Gomes da Cunha JP, Goncalves R, Silva F, Aguiar FN, Mota BS, Chequim BB, et al. Validation of the residual cancer burden index as a prognostic tool in women with locally advanced breast cancer treated with neoadjuvant chemotherapy. J Clin Pathol. 2023; 76: 239-243. (PMID: 34620608)
Bursac Z, Gauss CH, Williams DK, Hosmer DW. Purposeful selection of variables in logistic regression. Source Code Biol Med. 2008; 3: 17. (PMID: 19087314)
Hamy AS, Darrigues L, Laas E, De Croze D, Topciu L, Lam GT, et al. Prognostic value of the residual cancer burden index according to breast cancer subtype: validation on a cohort of BC patients treated by neoadjuvant chemotherapy. PLoS One. 2020; 15: e0234191. (PMID: 32579551)
Yau C, Osdoit M, van der Noordaa M, Shad S, Wei J, de Croze D, et al. Residual cancer burden after neoadjuvant chemotherapy and long-term survival outcomes in breast cancer: a multicentre pooled analysis of 5161 patients. Lancet Oncol. 2022; 23: 149-160. (PMID: 34902335)
Romero A, García-Sáenz JA, Fuentes-Ferrer M, López Garcia-Asenjo JA, Furió V, Román JM, et al. Correlation between response to neoadjuvant chemotherapy and survival in locally advanced breast cancer patients. Ann Oncol. 2013; 24: 655-661. (PMID: 23104719)
Supplementary Materials
Supplementary Figure 1. Kaplan-Meier survival curves. Distant recurrence-free survival - A: general population; B: luminal A; C: luminal B; D: overexpressed HER2; E: triple negative
RCB: Residual cancer burden; HER2: Human epidermal growth factor receptor 2
Supplementary Table 1. Percentage of distant recurrence-free, disease-free and overall 5-year survival in the whole study population and for molecular breast cancer subtypes
RCB class | - | - | % (± SD) | - | - |
|---|---|---|---|---|---|
- | Total | Luminal A | Luminal B | Overexpressed HER2 | Triple negative |
Distant recurrence-free survival | |||||
0 | 93.6 (3.1) | 100.0 (0.0) | 85.0 (8.0) | 100.0 (0.0) | 93.6 (3.6) |
I | 85.8 (5.9) | 100.0 (0.0) | 83.2 (7.7) | 75 (21.7) | 100.0 (0.0) |
II | 77.4 (2.6) | 96.5 (2.5) | 78.0 (3.5) | 66.9 (9.7) | 58.1 (7.3) |
III | 53.4 (3.9) | 76.2 (7.4) | 55.1 (5.1) | 38.1 (19.9) | 24.4 (8.2) |
Disease-free survival | |||||
0 | 93.7 (3.1) | 100.0(0.0) | 85.0 (8.0) | 100.0 (0.0) | 96.4 (3.5) |
I | 82.7 (6.4) | 100.0 (0.0) | 78.6 (8.5) | 75 (21.7) | 100.0 (0.0) |
II | 76.4 (2.6) | 92.9 (3.4) | 78.0 (3.5) | 68.0 (9.4) | 56.5 (7.3) |
III | 50.4 (3.9) | 76.3 (7.3) | 49.7 (5.1) | 42.9 (17.8) | 24.4 (8.2) |
Overall survival | |||||
0 | 93.5 (3.1) | 100.0 (0.0) | 89.7 (6.9) | 100.0 (0.0) | 93 (4.8) |
I | 91.2 (4.9) | 100.0 (0.0) | 87.0 (7.0) | 100.0 (0.0) | 100.0 (0.0) |
II | 80.1 (2.4) | 96.3 (2.6) | 85.3 (3.0) | 67.7 (9.5) | 50.9 (7.5) |
III | 60.3 (3.8) | 79.2 (7.0) | 64.9 (4.9) | 53.6 (20.1) | 23.8 (8.2) |
SD: Standard deviation; HER: Human epidermal growth factor receptor-type 2; RCB: Residual cancer burden
Supplementary Table 2. Univariate risk analyzes in the general population and molecular breast cancer subtypes regarding distant recurrence-free survival
- | Total | Luminal A | Luminal B | Overexpressed HER 2 | Triple negative | |||
|---|---|---|---|---|---|---|---|---|
Variables | HR (95% CI) p | HR (95% CI) p | HR (95% CI) p | HR (95% CI) p | HR (95% CI) p | |||
Mean age | 1.0 (1.0–1.1) 0.201 | 1.0 (1.0–1.1) 0.576 | 1.0 (1.0–1.1) 0.200 | 1.0 (1.0–1.1) 0.234 | 1.0 (1.0–1.1) 0.201 | |||
Menopausal status | ||||||||
Post-menopausal (>50 y) | Ref. | Ref. | Ref. | Ref. | Ref. | |||
Pre-menopausal (≤50 y) | 1.2 (0.9–1.6) 0.360 | 0.6 (0.2–2.1) 0.442 | 1.4 (0.9–2.1) 0.117 | 0.6 (0.2–1.8) 0.350 | 0.9 (0.7–1.2) 0.360 | |||
Race/skin color | - | - | - | - | ||||
White | Ref. | Ref. | Ref. | Ref. | Ref. | |||
Non-white | 1.0 (0.8–1.4) 0.908 | 4.2 (0.6–32.2) 0.172 | 1.1 (0.7–1.6) 0.870 | 0.5 (0.2–1.5) 0.215 | 1.0 (0.8–1.4) 0.908 | |||
Tumor size | ||||||||
T1/ T2 | Ref. | Ref. | Ref. | Ref. | Ref. | |||
T3 | 1.5 (1.0`–2.3) 0.049 | 2.2 (0.5–10.9) 0.335 | 2.0 (1.2–3.5) 0.014 | * 0.961 | 1.5 (1.0 –2.3) 0.049 | |||
T4 | 2.2 (1.5–3.3) <0.001 | 3.5 (0.9–14.1) 0.075 | 1.9 (1.1–3.3) 0.022 | 3.0 (1.0–8.5) 0.046 | 2.2 (1.5–3.3) <0.001 | |||
Lymph nodes | ||||||||
N0 | Ref. | Ref. | Ref. | Ref. | Ref. | |||
N1 | 1.6 (1.1–2.2) 0.012 | 1.4 (0.4–5.1) 0.652 | 1.6 (1.0–2.4) 0.053 | 1.3 (0.4–3.8) 0.674 | 1.6 (1.1–2.2) 0.012 | |||
N2/N3 | 1.6 (1.0–2.6) 0.059 | 3.2 (0.8–13.2) 0.117 | 1.4 (0.7–2.8) 0.319 | * 0.979 | 1.6 (1.0–2.6) 0.055 | |||
Estrogen receptor | ||||||||
Positive | Ref. | Ref. | Ref. | - | - | |||
Negative | 1.6 (1.2–2.2) 0.003 | 0.1 (*) 0.802 | 2.2 (0.8–6.0) 0.127 | - | - | |||
Progesterone receptor | - | - | - | - | ||||
Positive | Ref. | Ref. | Ref. | - | - | |||
Negative | 1.8 (1.3–2.4) <0.001 | 3.1 (0.9–10.2) 0.068 | 1.7 (1.0–2.7) 0.037 | - | - | |||
HER2 | ||||||||
Negative | Ref. | - | Ref. | - | - | |||
Positive | 0.9 (0.7–1.3) 0.647 | - | 1.2 (0.7–1.8) 0.556 | - | - | |||
Ki-67 | ||||||||
Low (≤14) | Ref. | - | Ref. | - | Ref. | |||
High (>14) | 2.3 (1.4–3.6) 0.001 | - | 0.7 (0.3–1.8) 0.463 | - | 2.3 (1.4–3.6) <0.001 | |||
Histological grade | ||||||||
I/ II | Ref. | Ref. | Ref. | Ref. | Ref. | |||
III | 1.4 (1.0–2.0) 0.032 | 0.1 (*) 0.614 | 1.2 (0.8–1.9) 0.454 | 0.9 (0.3–2.6) 0.784 | 1.5 (1.0–2.0) 0.032 | |||
Histological type | ||||||||
IDC | Ref. | Ref. | Ref. | Ref. | Ref. | |||
Other | 0.9 (0.5–1.6) 0.632 | 2.6 (0.8–8.5) 0.126 | 2.6 (0.8–8.5) 0.126 | 0.1 (*) 0.711 | 0.9 (0.5–1.6) 0.632 | |||
Molecular subtype | ||||||||
Luminal A | Ref. | - | - | - | - | |||
Luminal B | 2.8 (1.5–5.1) 0.001 | - | - | - | - | |||
Overexpressed HER2 | 2.5 (1.2–5.3) 0.024 | - | - | - | - | |||
Triple negative | 4.2 (2.2–8.0) <0.001 | - | - | - | - | |||
Variables | HR (95% CI) p | HR (95% CI) p | HR (95% CI) p | HR (95% CI) p | HR (95% CI) p | |||
Clinical staging | ||||||||
I/ II | Ref. | Ref. | Ref. | Ref. | Ref. | |||
III | 1.9 (1.4–2.7) <0.001 | 1.9 (0.6–6.1) 0.265 | 1.8 (1.2–2.9) 0.007 | 1.5 (0.5–4.4) 0.440 | 1.9 (1.4–2.7) <0.001 | |||
Breast surgery | ||||||||
Mastectomy | Ref. | Ref. | Ref. | Ref. | Ref. | |||
Breast conserving | 0.6 (0.4–1.0) 0.040 | 0.5 (0.1–3.9) 0.516 | 0.7 (0.4–1.3) 0.263 | 1.2 (0.3–5.5) 0.799 | 0.6 (0.4–0.9) 0.040 | |||
Axillary surgery | ||||||||
SLNB | Ref. | Ref. | Ref. | Ref. | Ref. | |||
SLNB + ALND | 1.9 (0.9–3.7) 0.086 | 1.4 (0.3–6.7) 0.644 | 1.6 (0.7–3.9) 0.280 | 2.9 (0.4–20.5) 0.172 | 1.9 (0.9–3.7) 0.086 | |||
ALND | 2.6 (1.6–4.2) <0.001 | 2.9 (0.4–20.5) 0.289 | 2.2 (1.2–4.2) 0.015 | 3.0 (0.2–48.8) 0.434 | 2.5 (1.6–4.2) <0.001 | |||
NAC regimen | ||||||||
Anthracyclic + Taxane | Ref. | Ref. | Ref. | Ref. | Ref. | |||
Other | 1.1 (0.4–3.0) 0.845 | 0.1 (*) 0.802 | 1.2 (0.2–4.8) 0.826 | 7.8 (0.9–71.3) 0.067 | 1.1 (0.4–3.0) 0.845 | |||
ypT | ||||||||
pCR | Ref. | Ref. | Ref. | Ref. | Ref. | |||
T1 | 1.8 (1.0–3.5) 0.071 | * 0.957 | 1.0 (0.4–2.0) 0.863 | 9.3 (1.1–80.0) 0.042 | 1.8 (1.0–3.5) 0.071 | |||
T2 | 4.3 (2.4–7.9) <0.001 | 1.2 (0.2–9.2) 0.875 | 2.7 (1.3–5.3) 0.006 | 21.0 (2.5–176.2) 0.005 | 4.3 (2.3–7.8) <0.001 | |||
T3/T4 | 5.5 (2.9–10.6) <0.001 | 0.5 (0.1–7.7) 0.605 | 2.7 (1.2–6.1) 0.020 | 16.6 (1.5–183.0) 0.022 | 5.5 (2.8–10.6) <0.001 | |||
YpN | ||||||||
N0 | Ref. | Ref. | Ref. | Ref. | Ref. | |||
N1 | 2.2 (1.5–3.2) <0.001 | 4.4 (0.9–22.6) 0.078 | 2.2 (1.3–3.7) 0.006 | 2.3 (0.7–7.8) 0.167 | 2.2 (1.5–3.2) <0.001 | |||
N2/ N3 | 4.0 (2.8–5.8) <0.001 | 8.3 (1.6–42.7) 0.012 | 3.7 (2.3–6.0) <0.001 | 3.6 (0.8–17.3) 0.108 | 4.0 (2.8–5.8) <0.001 | |||
RCB classes | ||||||||
RCB-0 | Ref. | Ref. | Ref. | Ref. | Ref. | |||
RCB-I | 2.9 (0.8–10.4) 0.096 | 1.0 (*) 1.000 | 1.4 (0.4–6.0) 0.627 | * 0.941 | 2.9 (0.8–10.4) 0.096 | |||
RCB-II | 4.3 (1.6–11.8) 0.005 | * 0.949 | 1.5 (0.5–5.0) 0.493 | * 0.940 | 4.3 (1.6–11.8) 0.005 | |||
RCB-III | 11.7 (4.3–31.8) <0.001 | * 0.940 | 4.8 (1.5–15.5) 0.008 | * 0.935 | 11.7 (4.3–31.8) <0.001 | |||
RCB index | 1.9 (1.6–2.2) <0.001 | 2.6 (1.3–5.1) 0.008 | 1.8 (1.5–2.2) <0.001 | 2.2 (1.4–3.3) <0.001 | 1.9 (1.6–2.1) <0.001 | |||
HR: Hazard ratio; CI: Confidence interval; NAC: Neoadjuvant chemotherapy; SLNB: Sentinel lymph node biopsy; ALND: Axillary lymph node dissection; HER2: Human epidermal growth factor receptor 2; RCB: Residual cancer burden; pCR: Pathological complete response; only valid values used; In bold, p<0.05; *not calculated
Supplementary Table 3. Univariate risk analyses in the whole study population and for molecular breast cancer subtypes regarding disease-free survival
- | Total | Luminal A | Luminal B | Overexpressed HER-2 | Triple negative |
|---|---|---|---|---|---|
Variables | HR (95% CI) p | HR (95% CI) p | HR (95% CI) p | HR (95% CI) p | HR (95% CI) p |
Mean age | 1.0 (1.0 –1.1) 0.201 | 1.0 (1.0–1.1) 0.614 | 1.0 (1.0–1.1) 0.191 | 1.0 (1.0–1.1) 0.231 | 1.0 (1.0–1.1) 0.756 |
Menopausal status | |||||
Post-menopausal (>50 y) | Ref. | Ref. | Ref. | Ref. | Ref. |
Pre-menopausal (≤50 y) | 1.2 (0.9–1.6) 0.376 | 0.6 (0.2–2.1) 0.427 | 1.4 (0.9–2.1) 0.115 | 0.6 (0.2–1.8) 0.367 | 1.1 (0.6–1.9) 0.841 |
Race/skin color | |||||
White | Ref. | Ref. | Ref. | Ref. | Ref. |
Non-white | 1.0 (0.7–1.4) 0.923 | 4.2 (0.6–32.5) 0.170 | 1.1 (0.7–1.6) 0.877 | 0.5 (0.2–1.5) 0.188 | 1.2 (0.7–2.3) 0.557 |
Tumor size | |||||
T1/ T2 | Ref. | Ref. | Ref. | Ref. | Ref. |
T3 | 1.5 (1.0`–2.3) 0.059 | 2.2 (0.4–10.6) 0.352 | 2.0 (1.2–3.6) 0.014 | * 0.960 | 0.9 (0.4–2.0) 0.805 |
T4 | 2.2 (1.5–3.2) <0.001 | 3.6 (0.9–14.2) 0.073 | 1.9 (1.1–3.3) 0.020 | 2.8 (1.0–8.0) 0.059 | 2.2 (1.1–4.5) 0.027 |
Lymph nodes | |||||
N0 | Ref. | Ref. | Ref. | Ref. | Ref. |
N1 | 1.6 (1.1–2.2) 0.011 | 1.4 (0.4–5.0) 0.657 | 1.6 (1.0–2.5) 0.044 | 1.3 (0.5–3.9) 0.625 | 1.3 (0.7–2.5) 0.434 |
N2/N3 | 1.6 (1.0–2.6) 0.059 | 3.0 (0.7–12.5) 0.134 | 1.5 (0.7–2.8) 0.298 | * 0.979 | 1.8 (0.8–4.0) 0.187 |
Estrogen receptor | |||||
Positive | Ref. | Ref. | Ref. | - | - |
Negative | 1.6 (1.2–2.2) 0.003 | 0.1 (*) 0.804 | 2.1 (0.8–5.7) 0.152 | - | - |
Progesterone receptor | |||||
Positive | Ref. | Ref. | Ref. | - | - |
Negative | 1.8 (1.3–2.4) <0.001 | 2.9 (0.9–9.7) 0.080 | 1.7 (1.1–2.8) 0.034 | - | - |
HER2 | |||||
Negative | Ref. | - | Ref. | - | - |
Positive | 0.9 (0.7–1.3) 0.635 | - | 0.9 (0.6–1.4) 0.512 | - | - |
Ki67 | |||||
Low (≤14) | Ref. | - | Ref. | - | Ref. |
High (>14) | 2.3 (1.4–3.6) 0.001 | - | 0.8 (0.3–1.9) 0.515 | - | 2.1 (0.5–8.5) 0.324 |
Histological grade | |||||
I/ II | Ref. | Ref. | Ref. | Ref. | Ref. |
III | 1.5 (1.1–2.0) 0.029 | 0.1 (*) 0.617 | 1.2 (0.8–2.0) 0.428 | 0.9 (0.3–2.5) 0.754 | 1.2 (0.6–2.3) 0.610 |
Histological type | |||||
IDC | Ref. | Ref. | Ref. | Ref. | Ref. |
Outros | 0.9 (0.5–1.6) 0.597 | 2.5 (0.8–8.2) 0.142 | 0.6 (0.2–1.6) 0.263 | 0.1 (*) 0.717 | 2.6 (0.8–8.5) 0.107 |
Molecular subtype | |||||
Luminal A | Ref. | - | - | - | - |
Luminal B | 2.8 (1.5–5.1) 0.001 | - | - | - | - |
Overexpressed HER2 | 2.5 (1.2–5.3) 0.022 | - | - | - | - |
Triple negative | 4.2 (2.2–7.9) <0.001 | - | - | - | - |
Clinical staging | |||||
I/ II | Ref. | Ref. | Ref. | Ref. | Ref. |
III | 1.9 (1.4–2.7) <0.001 | 1.9 (0.6–6.0) 0.271 | 1.9 (1.2–2.9) 0.006 | 1.5 (0.5–4.2) 0.488 | 1.9 (1.0–3.5) 0.050 |
Variables | HR (95% CI) p | HR (95% CI) p | HR (95% CI) p | HR (95% CI) p | HR (95% CI) p |
Breast surgery | |||||
Mastectomy | Ref. | Ref. | Ref. | Ref. | Ref. |
Breast conserving | 0.6 (0.4–1.0) 0.041 | 0.5 (0.1–4.0) 0.521 | 0.8 (0.4–1.3) 0.275 | 1.2 (0.3–5.5) 0.789 | 0.3 (0.1–0.8) 0.016 |
Axillary surgery | |||||
SLNB | Ref. | Ref. | Ref. | Ref. | Ref. |
SLNB + ALND | 1.9 (0.9–3.8) 0.086 | 1.5 (0.3–6.8) 0.639 | 1.6 (0.7–4.0) 0.277 | 3.5 (0.2–56.5) 0.375 | 1.5 (0.3–8.0) 0.664 |
ALND | 2.6 (1.6–4.2) <0.001 | 2.8 (0.4–19.6) 0.311 | 2.3 (1.2–4.2) 0.013 | 4.4 (0.6–33.9) 0.154 | 3.6 (1.3–10.0) 0.016 |
NAC regimen | |||||
Anthracyclic + Taxane | Ref. | Ref. | Ref. | Ref. | Ref. |
Other | 1.1 (0.4–3.0) 0.885 | 0.1 (*) 0.804 | 1.2 (0.3–4.8) 0.827 | 5.1 (0.6–41.6) 0.131 | 0.4 (0.1–3.0) 0.371 |
ypT | |||||
PCR | Ref. | Ref. | Ref. | Ref. | Ref. |
T1 | 1.9 (1.0–3.5) 0.067 | * 0.957 | 1.0 (0.5–2.1) 0.910 | 9.9 (1.2–84.8) 0.037 | 13.6 (1.8–105.4) 0.012 |
T2 | 4.3 (2.4–7.9) <0.001 | 1.2 (0.2–9.1) 0.882 | 2.8 (1.4–5.7) 0.005 | 17.4 (2.1–145.7) 0.008 | 21.5 (2.9–160.7) 0.003 |
T3/ T4 | 5.5 (2.9–10.6) <0.001 | 0.5 (0.1–7.6) 0.597 | 2.7 (1.2–6.1) 0.020 | 19.5 (1.8–215.2) 0.015 | 45.1(5.9–343.7)<0.001 |
ypN | |||||
N0 | Ref. | Ref. | Ref. | Ref. | Ref. |
N1 | 2.1 (1.5–3.1) <0.001 | 4.3 (0.8–21.9) 0.084 | 2.1 (1.3–3.6) 0.007 | 2.6 (0.8–8.4) 0.129 | 2.9 (1.4–6.0) 0.004 |
N2/ N3 | 4.2 (2.9–6.0) <0.001 | 8.3 (1.6–42.9) 0.011 | 3.9 (2.4–6.3) <0.001 | 4.9 (1.0–23.6) 0.046 | 11.0 (5.2–22.4)<0.001 |
RCB | |||||
RCB-0 | Ref. | Ref. | Ref. | Ref. | Ref. |
RCB-I | 2.9 (0.8–10.3) 0.099 | 1.0 (*) 1.000 | 1.4 (0.4 –6.0) 0.626 | * 0.913 | * 0.975 |
RCB-II | 4.3 (1.6–1.9) 0.005 | * 0.949 | 1.5 (0.5–5.0) 0.489 | * 0.912 | 17.0 (2.3–126.3) 0.006 |
RCB-III | 11.8 (4.3–32.0) <0.001 | * 0.940 | 5.0 (1.6–15.9) 0.007 | * 0.904 | 41.7 (5.6–309.7) <0.001 |
RCB index | 1.9 (1.6–2.2) <0.001 | 2.6 (1.3–5.2) 0.008 | 1.8 (1.5–2.2) <0.001 | 2.2 (1.5–3.3) <0.001 | 2.0 (1.6–2.5) <0.001 |
HR: Hazard ratio; CI: Confidence interval; NAC: Neoadjuvant chemotherapy; SLNB: Sentinel lymph node biopsy; ALND: Axillary lymph node dissection; HER2: Human epidermal growth factor receptor 2; pCR: Pathological complete response; only valid values used; In bold, p<0.05; *not calculated
Supplementary Table 4. Univariate risk analyzes in the whole study population and for molecular breast cancer subtypes regarding overall survival
- | Total | Luminal A | Luminal B | Overexpressed HER-2 | Triple Negative |
|---|---|---|---|---|---|
HR (95% CI) p | HR (95% CI) p | HR (95% CI) p | HR (95% CI) p | HR (95% CI) p | |
Mean age | 1.0 (1.0–1.1) 0.951 | 1.0 (0.9–1.1) 0.543 | 1.0 (1.0–1.1) 0.972 | 1.1 (1.0–1.1) 0.130 | 1.0 (1.0–1.1) 0.875 |
Menopausal status | |||||
Post-menopausal (>50 y) | Ref. | Ref. | Ref. | Ref. | Ref. |
Pre-menopausal (≤50 y) | 1.0 (0.7–1.4) 0.918 | 0.7 (0.2–2.6) 0.527 | 1.2 (0.7–2.0) 0.466 | 0.5 (0.2–1.7) 0.246 | 1.1 (0.6–2.0) 0.704 |
Race/skin color | |||||
White | Ref. | Ref. | Ref. | Ref. | Ref. |
Non-white | 1.0 (0.7–1.4) 0.777 | 3.0 (0.4– 24.0) 0.302 | 1.0 (0.6–1.7) 1.000 | 0.6 (0.2–1.9) 0.363 | 1.1 (0.6–1.9) 0.894 |
Tumor size | |||||
T1/ T2 | Ref. | Ref. | Ref. | Ref. | Ref. |
T3 | 1.3 (0.8–2.2) 0.258 | 6.6 (0.7–63.3) 0.103 | 1.4 (0.7–2.8) 0.354 | * 0.963 | 1.0 (0.4–2.5) 0.806 |
T4 | 2.4 (1.6–3.6) <0.001 | 8.7 (1.0–74.3) 0.049 | 1.8 (1.0–3.5) 0.067 | 2.4 (0.7–7.8) 0.157 | 1.9 (1.0–3.9) 0.085 |
Lymph nodes | |||||
N0 | Ref. | Ref. | Ref. | Ref. | Ref. |
N1 | 1.4 (1.0–2.1) 0.085 | 1.7 (0.4–8.3) 0.528 | 1.6 (0.9–2.7) 0.122 | 0.6 (0.2–2.0) 0.389 | 1.2 (0.7–2.4) 0.547 |
N2/N3 | 1.9 (1.1–3.1) 0.020 | 5.2 (1.1–25.5) 0.045 | 1.6 (0.7–3.6) 0.253 | * 0.982 | 1.9 (0.9–4.3) 0.103 |
Estrogen receptor | |||||
Positive | Ref. | Ref. | Ref. | - | - |
Negative | 2.5 (1.8–3.5) <0.001 | 0.1 (*) 0.830 | 3.5 (1.3–9.5) 0.017 | - | - |
Progesterone receptor | |||||
Positive | Ref. | Ref. | Ref. | - | - |
Negative | 2.4 (1.7–3.4) <0.001 | 3.1 (0.8–12.2) 0.116 | 1.7 (0.9–3.1) 0.093 | - | - |
HER2 | |||||
Negative | Ref. | - | Ref. | - | - |
Positive | 0.9 (0.6–1.3) 0.391 | - | 1.0 (0.6–1.8) 0.964 | - | - |
Ki-67 | |||||
Low (≤14) | Ref. | - | Ref. | Ref. | Ref. |
High (>14) | 1.8 (1.1–3.0) 0.020 | - | 0.5 (0.2–1.2) 0.094 | 0.3 (0.1–1.2) 0.072 | 2.1 (0.5–8.5) 0.316 |
Histological grade | |||||
I/ II | Ref. | Ref. | Ref. | Ref. | Ref. |
III | 1.5 (1.0–2.1) 0.040 | 0.1 (*) 0.666 | 1.3 (0.7–2.3) 0.430 | 0.4 (0.1–1.6) 0.193 | 0.9 (0.5–1.6) 0.677 |
Histological type | |||||
ICD | Ref. | Ref. | Ref. | Ref. | Ref. |
Other | 0.9 (0.5–1.8) 0.785 | 2.5 (0.6–9.8) 0.208 | 0.7 (0.2–2.2) 0.521 | 0.1(*) 0.736 | 2.2 (0.7–7.1) 0.185 |
Molecular subtype | |||||
Luminal A | Ref. | - | - | - | - |
Luminal B | 2.3 (1.1–4.6) 0.021 | - | - | - | - |
Overexpressed HER2 | 2.4 (1.0–5.8) 0.051 | - | - | - | - |
Triple negative | 5.8 (2.8–11.8) <0.001 | - | - | - | - |
Clinical staging | |||||
I/ II | Ref. | Ref. | Ref. | Ref. | Ref. |
III | 2.1 (1.4–3.0) <0.001 | 2.5 (0.7–9.8) 0.208 | 2.0 (1.2–3.5) 0.015 | 1.4 (0.4–4.4) 0.629 | 2.0 (1.1–3.8) 0.030 |
Breast surgery | |||||
Mastectomy | Ref. | Ref. | Ref. | Ref. | Ref. |
Breast conserving | 0.5 (0.3–0.9) 0.023 | 0.4 (*) 0.422 | 0.7 (0.4–1.5) 0.379 | 0.7 (0.1–5.2) 0.691 | 0.3 (0.1–0.8) 0.014 |
Axillary surgery | |||||
SLNB | Ref. | Ref. | Ref. | Ref. | Ref. |
SLNB + ALND | 1.8 (0.8–4.2) 0.204 | * 0.950 | 1.7 (0.6–5.0) 0.350 | 2.8 (0.4–22.3) 0.326 | 0.8 (0.1–7.0) 0.821 |
ALND | 3.0 (1.7–5.4) <0.001 | * 0.950 | 2.2 (1.0–4.8) 0.057 | 2.8 (0.2–45.2) 0.466 | 3.8 (1.4–10.7) 0.011 |
NAC regimen | |||||
Anthracyclic + Taxane | Ref. | Ref. | Ref. | Ref. | Ref. |
Other | 1.5 (0.5–3.9) 0.477 | 0.1 (*) 0.830 | 0.9 (0.1–6.5) 0.910 | 12.7 (1.2–139.7) 0.038 | 0.8 (0.2–3.4) 0.793 |
ypT | |||||
pCR | Ref. | Ref. | Ref. | Ref. | Ref. |
T1 | 2.0 (0.9–4.4) 0.080 | 1.0 (*) 1.000 | 0.9 (0.3–2.3) 0.767 | * 0.918 | 6.9 (1.5–31.1) 0.012 |
T2 | 4.9 (2.4–10.2) <0.001 | * 0.948 | 2.5 (1.0–6.0) 0.044 | * 0.911 | 11.7 (2.8–50.0) 0.001 |
T3/ T4 | 6.8 (3.1–15.0) <0.001 | * 0.951 | 3.2 (1.2–8.4) 0.021 | * 0.917 | 22.0 (5.0–97.8) <0.001 |
ypN | |||||
N0 | Ref. | Ref. | Ref. | Ref. | Ref. |
N1 | 1.7 (1.1–2.7) 0.018 | * 0.925 | 1.4 (0.7–2.9) 0.387 | 2.3 (0.6–9.2) 0.240 | 2.8 (1.4–5.6) 0.005 |
N2/ N3 | 3.7 (2.5–5.4) <0.001 | * 0.919 | 3.4 (1.9–5.9) <0.001 | 5.7 (1.1–29.1) 0.035 | 9.3 (4.6–19.0) <0.001 |
RCB class | |||||
RCB-0 | Ref. | Ref. | Ref. | Ref. | Ref. |
RCB-I | 1.4 (0.3–6.3) 0.655 | 1.0 (*) 1.000 | 1.3 (0.2–7.8) 0.768 | 1.0 (*) 1.000 | * 0.981 |
RCB-II | 3.5 (1.3–9.7) 0.015 | * 0.961 | 1.6 (0.4–6.7) 0.542 | * 0.941 | 9.0 ( 2.1–38.2) 0.003 |
RCB-III | 8.1 (2.9–22.1) <0.001 | * 0.951 | 4.3 (1.0–17.8) 0.046 | * 0.939 | 21.5 (5.1–91.9) <0.001 |
RCB index | 1.8 (1.5–2.1) <0.001 | 5.2 (1.7–16.0) 0.004 | 1.7 (1.3–2.1) <0.001 | 1.8 (1.2–2.8) 0.008 | 2.0 (1.6–2.5) <0.001 |
HR: Hazard ratio; CI: Confidence interval; NAC: Neoadjuvant chemotherapy; SLNB: Sentinel lymph node biopsy; ALND: Axillary lymph node dissection; HER2: Human epidermal growth factor receptor 2; RCB: Residual cancer burden; pCR: Pathological complete response; only valid values used; In bold, p<0.05; *not calculated