
Abstract
Objective
Breast cancer is the most common cancer and the leading cause of cancer-related deaths in women. Texture analysis provides crucial prognostic information about many types of cancer, including breast cancer. The aim was to examine the relationship between texture features (TFs) of 2-deoxy-2[18F]fluoro-D-glucose positron emission tomography (PET)/computed tomography and disease progression in patients with invasive breast cancer.
Materials and Methods
TFs of the primary malignant lesion were extracted from PET images of 112 patients. TFs that showed significant differences between patients who achieved one-, three-, and five-year progression-free survival (PFS) and those who did not were selected and subjected to the least absolute shrinkage and selection operator regression method to reduce features and prevent overfitting. Machine learning (ML) was used to predict PFS using TFs and selected clinicopathological parameters.
Results
In models using only TFs, random forest predicted one-, three-, and five-year PFS with area under the curve (AUC) values of 0.730, 0.758, and 0.797, respectively. Naive Bayes predicted one-, three-, and five-year PFS with AUC values of 0.857, 0.804, and 0.843, respectively. The neural network predicted one-, three-, and five-year PFS with AUC values of 0.782, 0.828, and 0.780, respectively. These findings indicated increased AUC values when the models combined TFs with clinicopathological parameters. The lowest AUC values of the models combining TFs and clinicopathological parameters when predicting one-year, three-year, and five-year PFS were 0.867, 0.898, and 0.867, respectively.
Conclusion
ML models incorporating PET-derived TFs and clinical parameters may assist in predicting progression during the pre-treatment period in patients with invasive breast carcinoma.
Keywords: Texture analysis, machine learning, breast carcinoma, PET/CT, progression-free survival
Key Points
• Invasive breast carcinoma may progress after initial treatment.
• Positron emission tomography/computed tomography (PET/CT) parameters obtained before initial treatment can predict disease progression.
• Combining PET/CT texture features with clinicopathological parameters improves prediction of progression.
Introduction
Breast cancer is the most common cancer and the leading cause of cancer-related deaths in women (). Accurate staging of the disease is essential for successful treatment. 2-deoxy-2[18F]fluoro-D-glucose ([18F]FDG) positron emission tomography/computed tomography (PET/CT) is frequently used in oncology for purposes, such as staging various cancer types, evaluating response to treatment, determining radiotherapy fields, and detecting recurrence (). Routine use of PET/CT is not recommended for patients with stage I-II or operable stage III breast cancer (-). However, PET/CT may be helpful when findings on other imaging modalities used for staging are uncertain. In addition, PET/CT is able to delineate many clinicopathological prognostic parameters in breast cancer ().
Texture analysis (TA) of medical images, also known as radiomics, has recently become one of the most popular topics in research. TA allows medical images to provide more information than the human eye can detect (). TA of PET/CT offers prognostic information about various malignancies, including breast cancer (-). In breast cancer, PET/CT-based TA has been used to characterize lesions, evaluate tumor biology, including grade and immunohistochemical marker expression, predict response to neoadjuvant chemotherapy, and predict disease-free survival (DFS) (). Currently, TA is primarily used for preclinical and research purposes because improvements and standardization of methodology are needed before TA can be integrated into clinical workflow. Early studies in the field of TA in breast cancer focused on predicting histopathological and immunohistochemical parameters, as well as treatment responses. Nevertheless, there are only a limited number of studies on TA and breast cancer survival. The aim of this study was to examine the relationship between [18F]FDG PET/CT-derived TA and progression-free survival (PFS) in invasive breast carcinoma using machine learning (ML)-based analysis.
Materials and Methods
Patients
This study retrospectively identified and included 290 female patients diagnosed with invasive breast carcinoma who underwent PET/CT for staging at a single center between 2019 and 2022. During this period, PET/CT scans were routinely performed for staging purposes in female patients with invasive breast cancer whose primary tumor was larger than one centimeter. The exclusion criteria were: Inability to determine disease progression due to inaccessible medical records; inability to perform TA due to the metabolic volume of the primary tumor being less than 64 voxels on PET/CT images; and presence of a second malignancy. After applying these criteria, a total of 112 patients were included in the study ().
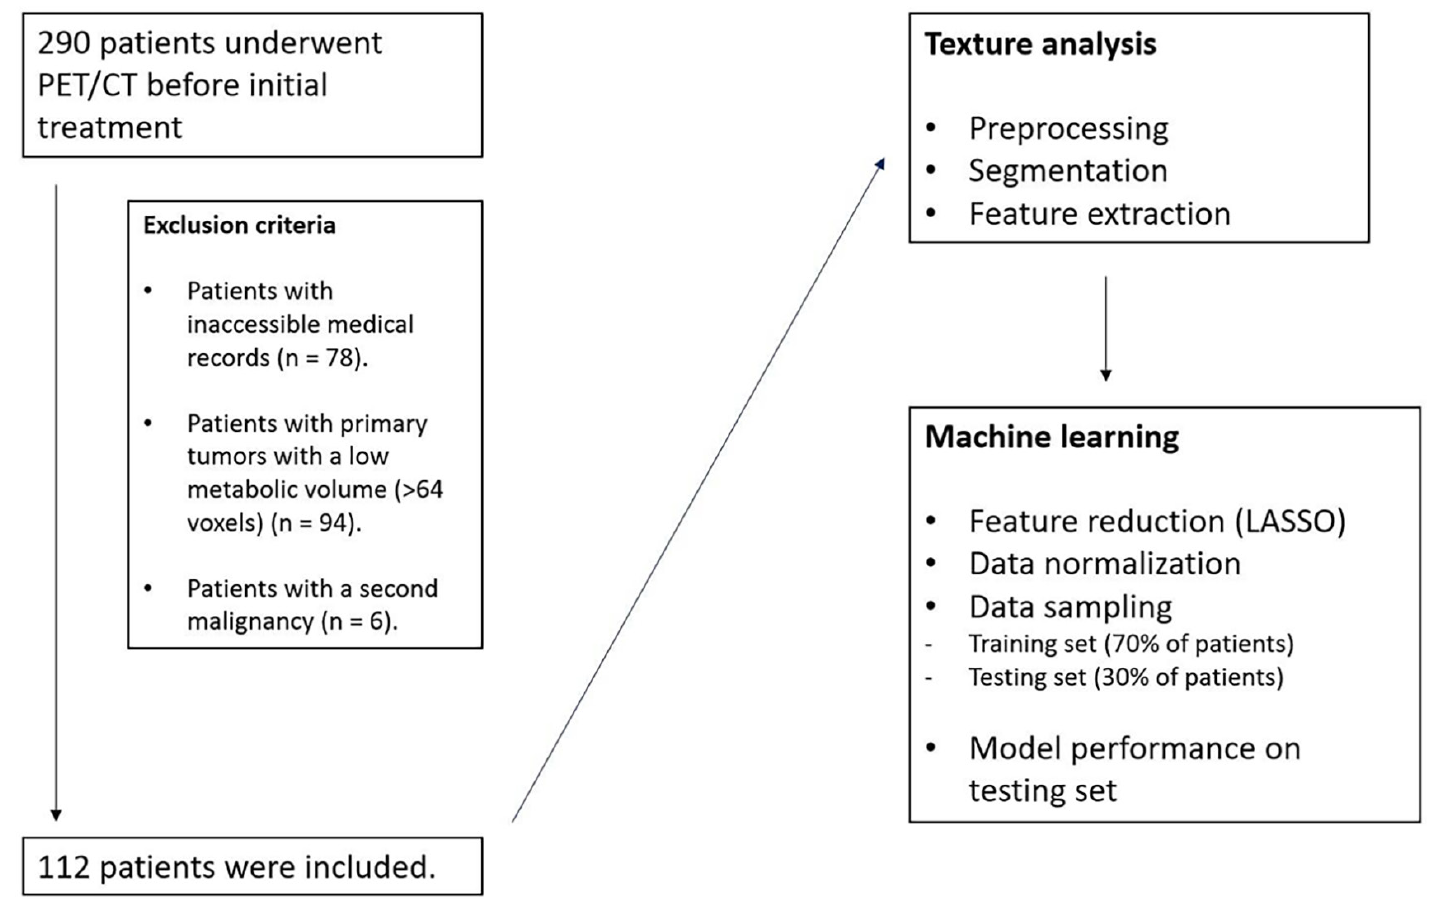
PET/CT: Positron emission tomography/computed tomography; LASSO: Least absolute shrinkage and selection operator
PET/CT Imaging Protocol
Following six hours of fasting, patients with a blood glucose level below 200 mg/dL received an intravenous injection of 0.1 mCi/kg [18F]FDG. The patients were then asked to rest in a quiet, darkened room for approximately 60 minutes. PET/CT imaging was performed from the vertex to the mid-thigh using a Siemens Biograph mCT 20 PET/CT system (Siemens, Germany). First, nondiagnostic CT images were obtained using the following parameters: 120 kVp, 50 mAs, and 5-mm slice thickness. PET imaging was then performed for 2 minutes per bed position. PET images were corrected for attenuation using the corresponding nondiagnostic CT images. The ordered-subset expectation maximization method was used for image reconstruction.
Texture Analysis
TA was performed using LIFEx software version 7.4.0 (lifexsoft.org) by two nuclear medicine physicians with six and nine years of experience in oncological PET/CT interpretation. LIFEx is a freely available software tool widely used for TA in the medical imaging literature (). Attenuation-corrected PET images were imported into the LIFEx program. The primary breast lesions were manually segmented using a three-dimensional region of interest (ROI), defined to correspond with radiological findings. A threshold of 40% of the maximum standardized uptake value (SUVmax) was used to delineate the ROI (). Segmentation was independently performed by both nuclear medicine physicians. For spatial resampling of the ROI, a voxel spacing of 4×4×4 mm was applied along the x, y, and z axes. Image intensity was discretized into 64 gray levels with a bin width of 0.3. Intensity rescaling was conducted using an absolute scale range of 0–20. Texture features (TFs) extracted from the three-dimensional ROI included first-order features, such as morphological, intensity-based, local intensity-based, intensity histogram, and local intensity histogram, as well as second-order features such as intensity-based rim, intensity histogram rim, gray-level co-occurrence matrix, neighboring gray-tone difference matrix, gray-level run-length matrix, and gray-level size zone matrix ().
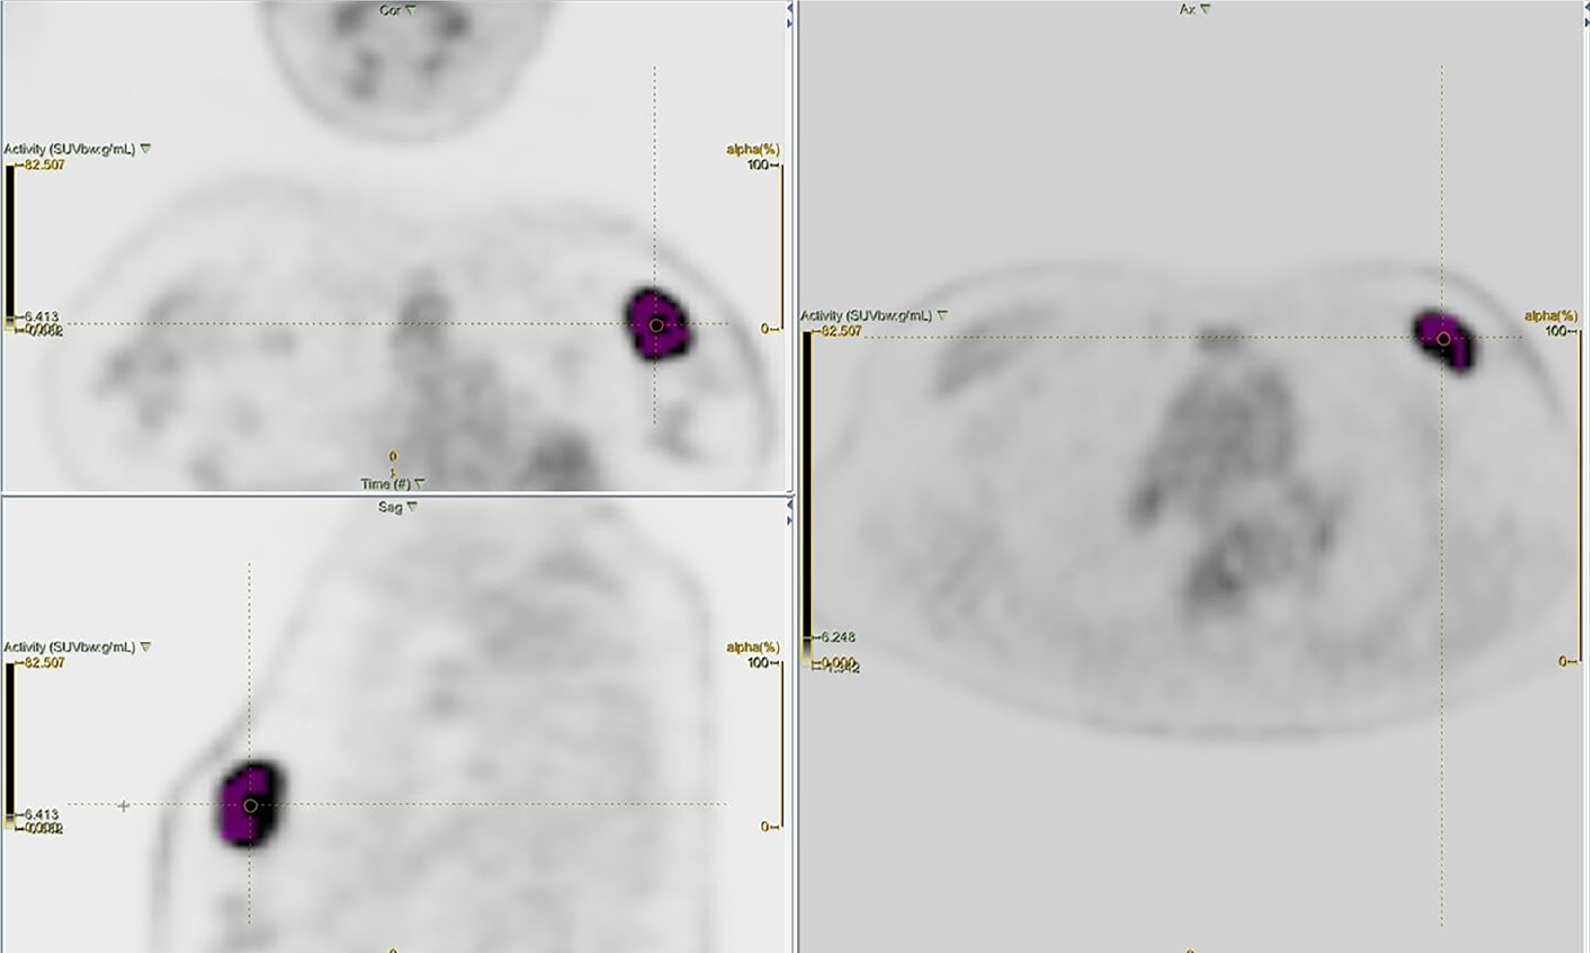
SUVmax: Maximum standardized uptake value
Determination of PFS
To determine progression, imaging findings defined from molecular imaging methods (PET/CT and bone scintigraphy) and morphological imaging methods [breast ultrasound (US), breast magnetic resonance imaging (MRI), and thoracic-abdominopelvic CT or MRI] obtained during follow-up were compared with baseline staging images. PET/CT images were evaluated according to the PERCIST criteria, while CT and MRI findings were assessed according to the RECIST 1.1 criteria (). The appearance of new bone metastases at previously uninvolved non-metastatic locations on bone scintigraphy and signs of recurrence or progression at the primary tumor site identified through mammography and/or breast US were also accepted as indicators of progression. PFS was defined as the time interval between the date of breast cancer diagnosis and the first radiological evidence of progression, based on the criteria outlined above. For patients without progression, PFS was calculated as the time between the date of diagnosis and the date of last follow-up. The number of patients who achieved one-, three-, and five-year PFS was recorded.
The Recep Tayyip Erdogan University Ethics Committee approved this study (approval no: 2022/228, date: 22.12.2022). The ethical committee waived the requirement for informed consent as the study was retrospective. All procedures performed in this study were in accordance with the ethical standards of the institutional and/or national research committee and with the 1964 Helsinki Declaration and its later amendments.
Statistical Analysis and ML
All statistical analyses were performed using SPSS, version 24 (IBM Corp., Armonk, NY, USA). A p-value of <0.05 was considered statistically significant. The Mann-Whitney U test was used to compare the TFs of patients who achieved one-, three-, and five-year PFS with those who did not. TFs with a p-value of <0.05 were subjected to feature reduction using the least absolute shrinkage and selection operator (LASSO) regression method to prevent model overfitting (). To predict PFS, three ML algorithms commonly used in medical imaging research, specifically random forest, naive Bayes, and neural network, were employed using both TFs and selected clinicopathological parameters. ML models were developed using the Orange data mining toolbox (version 3.34.0).
The dataset was randomly divided into training (70% of patients) and testing (30% of patients) sets. The mean ages of patients with and without progression were compared using the independent-samples t-test. Categorical variables, such as estrogen receptor (ER) status, progesterone receptor (PR) status, human epidermal growth factor receptor 2 (HER2) status, and cancer stage were compared between these groups using the chi-square test.
All data were normalized to a 0–1 scale prior to model training. Each ML model was trained on the training set using 10-fold cross-validation and subsequently evaluated on the testing set for internal validation. After this initial evaluation, selected clinical parameters were added to the models, and their predictive performance for achieving PFS was re-examined.
Results
The mean age of the patients was 59±14 years. The median follow-up period was 112 (30–311) weeks. During follow-up, progression occurred in 21 patients (19%) within the first year, 43 (38%) within three years, and 46 (41%) within five years. One-, three-, and five-year PFS rates were 81%, 62%, and 59%, respectively. The five-year PFS rate was 88% in non-metastatic patients and 47% in metastatic patients. The majority of patients had invasive ductal carcinoma. Most cases were ER (+), PR (+), and HER2 (-) and had locally advanced breast cancer (LABC) () ().
Table 1. Detailed characteristics of patients
Variables | - | |
|---|---|---|
Age (years), mean ± SD | 59±14 | |
Primary tumor size (mm), median (minimum-maximum) | 28 (13–100) | |
Histopathological subtype, n (%) | IDC | 64 (57) |
ILC | 4 (3) | |
NST | 30 (27) | |
Others | 14 (13) | |
ER status, n (%) | ER (+) | 79 (71) |
ER (-) | 27 (24) | |
N/A | 6 (5) | |
PR status, n (%) | PR (+) | 73 (65) |
PR (-) | 33 (30) | |
N/A | 6 (5) | |
HER2 status, n (%) | HER2 (+) | 33 (30) |
HER2 (-) | 73 (65) | |
N/A | 6 (5) | |
TNM stage, n (%) | Early * | 33 (30) |
Locally advanced** | 49 (44) | |
Distant metastatic | 30 (26) | |
Surgery history, n (%) | No surgery | 32 (29) |
Mastectomy | 56 (50) | |
Breast-conserving surgery | 24 (21) | |
Chemotherapy, n (%) | Yes | 87 (78) |
No | 25 (22) | |
Radiotherapy, n (%) | Yes | 70 (63) |
No | 42 (37) | |
Hormonal therapy, n (%) | Yes | 79 (74) |
No | 27 (21) | |
N/A | 6 (5) | |
Anti-HER2 therapy, n (%) | Yes | 33 (30) |
No | 73 (65) | |
N/A | 6 (5) | |
SD: Standard deviation; IDC: Invasive ductal carcinoma; ILC: Invasive lobular carcinoma; NST: No special type; ER: Estrogen receptor; PR: Progesterone receptor; N/A: Not available; HER2: Human epidermal growth factor receptor 2; TNM: Tumor, node, and metastasis
*: Includes TNM stages I, IIA, IIB, and IIIA
**: Includes TNM stages IIIB and IIIC
The median primary tumor size was larger in patients who did not achieve one-, three-, and five-year PFS compared to those who did. ER (+) and PR (+) rates were higher among patients who achieved three- and five-year PFS than in those who did not. HER2 receptor status was similar between patients with and without progression at all time points. Lastly, distant and axillary metastases at diagnosis were more common in patients who did not achieve one-, three-, and five-year PFS (, , and ).
Table 2. Patient characteristics according to one-year PFS
Variables | Patients who achieved one-year PFS (n = 91) | Patients who did not achieve one-year PFS (n = 21) | p-value | |
|---|---|---|---|---|
Age, mean ± SD | 58±13 | 62±14 | 0.253 | |
Primary tumor size (mm), median (minimum-maximum) | 25 (13–80) | 40 (18–100) | 0.005 | |
Histopathological subtype, n (%) | ||||
IDC | 55 (60) | 9 (43) | 0.222 | |
Others | 36 (40) | 12 (57) | ||
ER status, n (%) | ||||
ER (+) | 67 (74) | 6 (29) | 0.095 | |
ER (-) | 21 (23) | 12 (57) | ||
N/A | 3 (3) | 3 (14) | ||
PR status, n (%) | ||||
PR (+) | 62 (68) | 11 (53) | 0.099 | |
PR (-) | 26 (29) | 7 (33) | ||
N/A | 3 (3) | 3 (14) | ||
HER2 status, n (%) | ||||
HER2 (+) | 27 (30) | 6 (29) | 0.825 | |
HER2 (-) | 61 (67) | 12 (57) | ||
N/A | 3 (3) | 3 (14) | ||
Axillary metastasis, n (%) | ||||
Present | 53 (58) | 19 (90) | 0.005 | |
Absent | 38 (42) | 2 (10) | ||
TNM stage, n (%) | - | - | - | - |
Early* | 32 (35) | 1 (5) | <0.001 | |
Locally advanced** | 44 (48) | 7 (33) | ||
Distant metastatic | 15 (17) | 13 (62) | ||
Surgery history, n (%) | ||||
Yes | 75 (66) | 5 (4) | <0.001 | |
No | 16 (15) | 16 (15) | ||
Chemotherapy, n (%) | ||||
Yes | 68 (61) | 19 (17) | 0.152 | |
No | 23 (20) | 2 (2) | ||
Radiotherapy, n (%) | ||||
Yes | 62 (54) | 8 (7) | 0.012 | |
No | 28 (26) | 14 (13) | ||
PFS: Progression-free survival; SD: Standard deviation; IDC: Invasive ductal carcinoma; ER: Estrogen receptor; N/A: Not available; PR: Progesterone receptor; HER2: Human epidermal growth factor receptor 2; TNM: Tumor, node, and metastasis
*: Includes TNM stages I, IIA, IIB, and IIIA
**: Includes TNM stages IIIB and IIIC
Table 3. Patient characteristics according to three-year PFS
Variables | Patients who achieved three-year PFS (n = 69) | Patients who did not achieve three-year PFS (n = 43) | p-value | |
|---|---|---|---|---|
Age, mean ± SD | 57±13 | 60±14 | 0.373 | |
Primary tumor size (mm), median (minimum-maximum) | 25 (13–62) | 39 (18–100) | <0.001 | |
Histopathological subtype, n (%) | ||||
IDC | 42 (61) | 22 (51) | 0.380 | |
Others | 27 (39) | 21 (49) | ||
ER status, n (%) | ||||
ER (+) | 54 (79) | 25 (58) | 0.021 | |
ER (-) | 14 (20) | 13 (30) | ||
N/A | 1 (1) | 5 (12) | ||
PR status, n (%) | ||||
PR (+) | 51 (74) | 22 (51) | 0.013 | |
PR (-) | 17 (25) | 16 (37) | ||
N/A | 1 (1) | 5 (12) | ||
HER2 status, n (%) | ||||
HER2 (+) | 21 (31) | 12 (28) | 0.941 | |
HER2 (-) | 47 (68) | 26 (60) | ||
N/A | 1 (1) | 5 (12) | ||
Axillary metastasis, n (%) | ||||
Present | 35 (51) | 37 (86) | <0.001 | |
Absent | 34 (49) | 6 (14) | ||
TNM stage, n (%) | ||||
Early* | 29 (42) | 4 (9) | <0.001 | |
Locally advanced** | 36 (52) | 15 (35) | ||
Distant metastatic | 4 (6) | 24 (56) | ||
Surgery history, n (%) | ||||
Yes | 64 (57) | 16 (14) | <0.001 | |
No | 5 (4) | 27 (25) | ||
Chemotherapy, n (%) | ||||
Yes | 52 (47) | 35 (31) | 0.494 | |
No | 17 (15) | 8 (7) | ||
Radiotherapy, n (%) | ||||
Yes | 48 (44) | 22 (20) | 0.045 | |
No | 21 (18) | 21 (18) | ||
PFS: Progression-free survival; SD: Standard deviation; IDC: Invasive ductal carcinoma; ER: Estrogen receptor; N/A: Not available; PR: Progesterone receptor; HER2: Human epidermal growth factor receptor 2, TNM: Tumor, node, and metastasis
*: Includes TNM stages I, IIA, IIB, and IIIA
**: Includes TNM stages IIIB and IIIC
Table 4. Patient characteristics according to five-year PFS
Variables | Patients who achieved five-year PFS (n = 66) | Patients who did not achieve five-year PFS (n = 46) | p-value |
|---|---|---|---|
Age, mean ± SD | 58±13 | 60±13 | 0.475 |
Primary tumor size (mm), median (minimum-maximum) | 25 (13–62) | 38 (15–100) | <0.001 |
Histopathological subtype, n (%) | |||
IDC | 40 (60) | 24 (52) | 0.285 |
Others | 26 (40) | 22 (48) | |
ER status, n (%) | - | - | - |
ER (+) | 51 (78) | 28 (61) | 0.046 |
ER (-) | 14 (21) | 13 (28) | |
N/A | 1 (1) | 5 (11) | |
PR status, n (%) | - | - | - |
PR (+) | 48 (73) | 25 (54) | 0.037 |
PR (-) | 17 (26) | 16 (35) | |
N/A | 1 (1) | 5 (11) | |
HER2 status, n (%) | - | - | - |
HER2 (+) | 20 (30) | 13 (28) | 0.919 |
HER2 (-) | 45 (69) | 28 (61) | |
N/A | 1 (1) | 5 (11) | |
Axillary metastasis, n (%) | |||
Present | 32 (48) | 40 (87) | <0.001 |
Absent | 34 (52) | 6 (13) | |
TNM stage, n (%) | - | - | - |
Early* | 29 (44) | 4 (9) | <0.001 |
Locally advanced** | 34 (51) | 17 (37) | |
Distant metastatic | 3 (5) | 25 (54) | |
Surgery history, n (%) | |||
Yes | 61 (54) | 19 (17) | <0.001 |
No | 5 (4) | 27 (25) | |
Chemotherapy, n (%) | |||
Yes | 49 (44) | 38 (34) | 0.360 |
No | 17 (15) | 8 (7) | |
Radiotherapy, n (%) | |||
Yes | 48 (44) | 22 (20) | 0.045 |
No | 21 (18) | 21 (18) | |
PFS: Progression-free survival; SD: Standard deviation; IDC: Invasive ductal carcinoma; ER: Estrogen receptor; N/A: Not available; PR: Progesterone receptor; HER2: Human epidermal growth factor receptor 2; TNM: Tumor, node, metastasis
*: Includes TNM stages I, IIA, IIB, and IIIA
**: Includes TNM stages IIIB and IIIC
A total of 25, 58, and 57 of the TFs showed significant differences between patients who achieved one-, three-, and five-year PFS, respectively, and those who did not. These TFs were subjected to LASSO regression. Selected TFs () and relevant clinicopathological parameters that differed between the two patient groups (primary tumor size, ER and PR status, and axillary and distant metastases) were then used in ML models to predict PFS at one, three, and five-years.
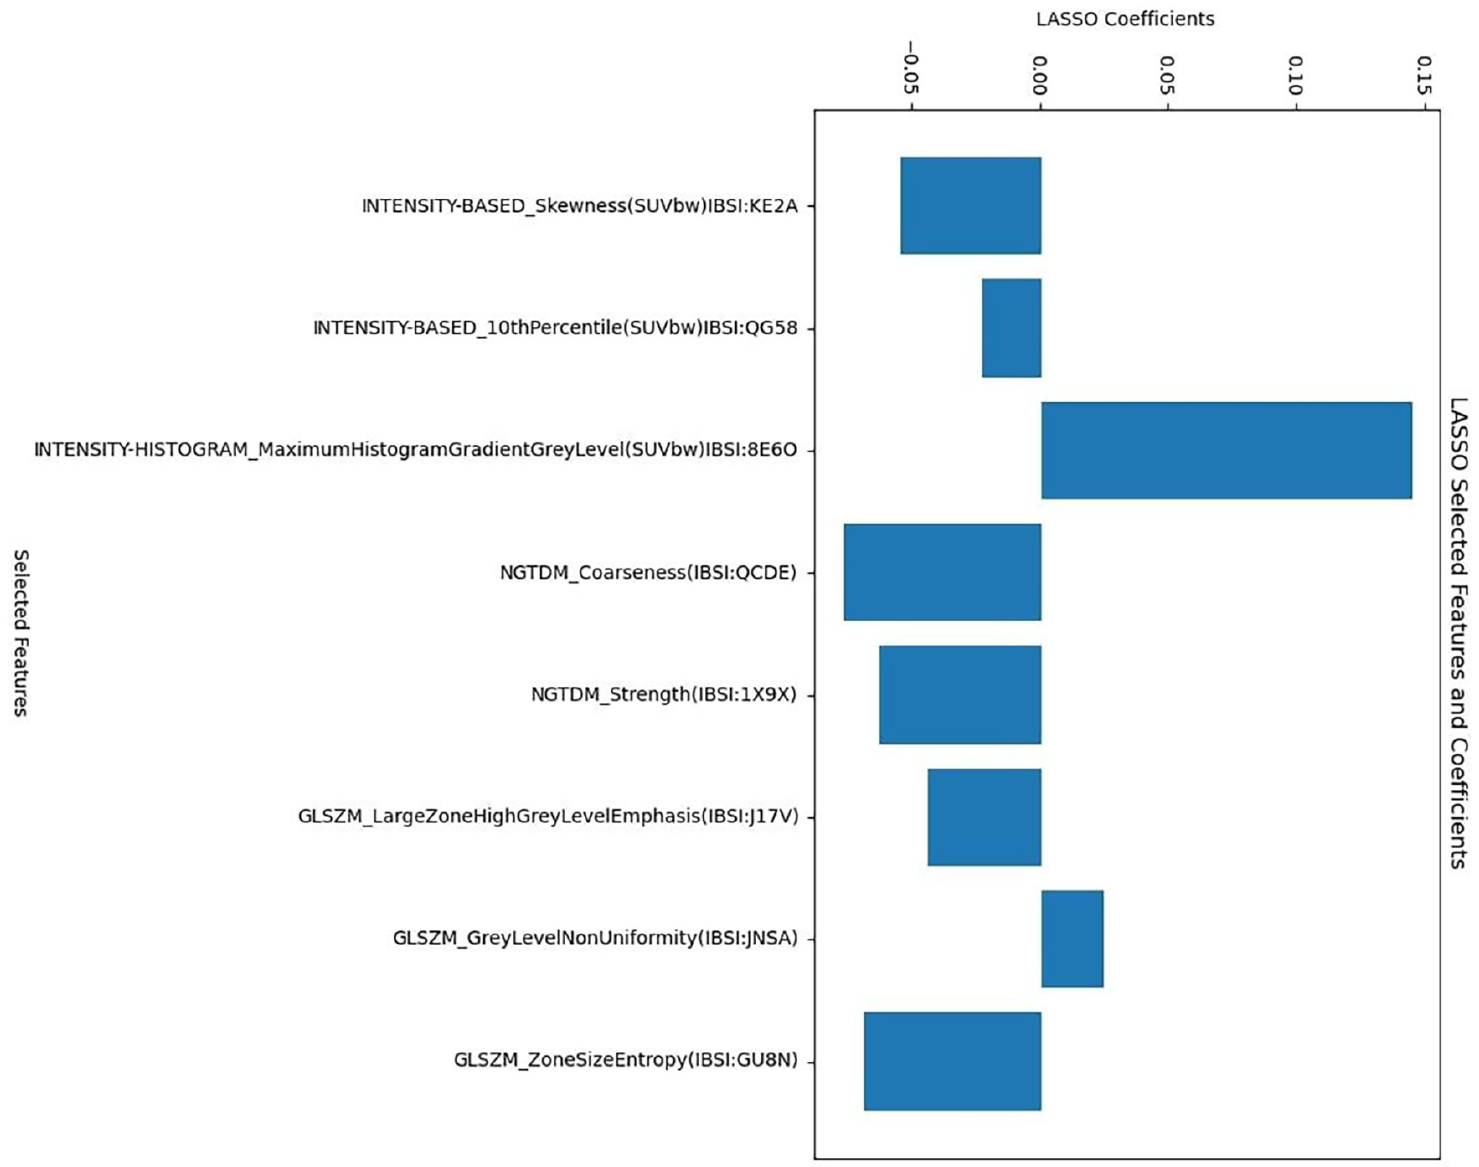
LASSO: Least absolute shrinkage and selection operator
The higher incidence of distant metastases among patients who did not achieve PFS at one, three, and five years suggested that the lower rates of surgery and radiotherapy in these patients were a consequence rather than a cause of their poor prognosis. Therefore, the history of surgery and radiotherapy was not included in the ML models. Among the models using only TFs, random forest predicted one-, three-, and five-year PFS with area under the curve (AUC) values of 0.730, 0.758, and 0.797, respectively. Naive Bayes predicted one-, three-, and five-year PFS with AUC values of 0.857, 0.804, and 0.843, respectively. The neural network predicted one-, three-, and five-year PFS with AUC values of 0.782, 0.828, and 0.780, respectively. AUC values improved when clinicopathological parameters were added to the TFs ( and , , and ).
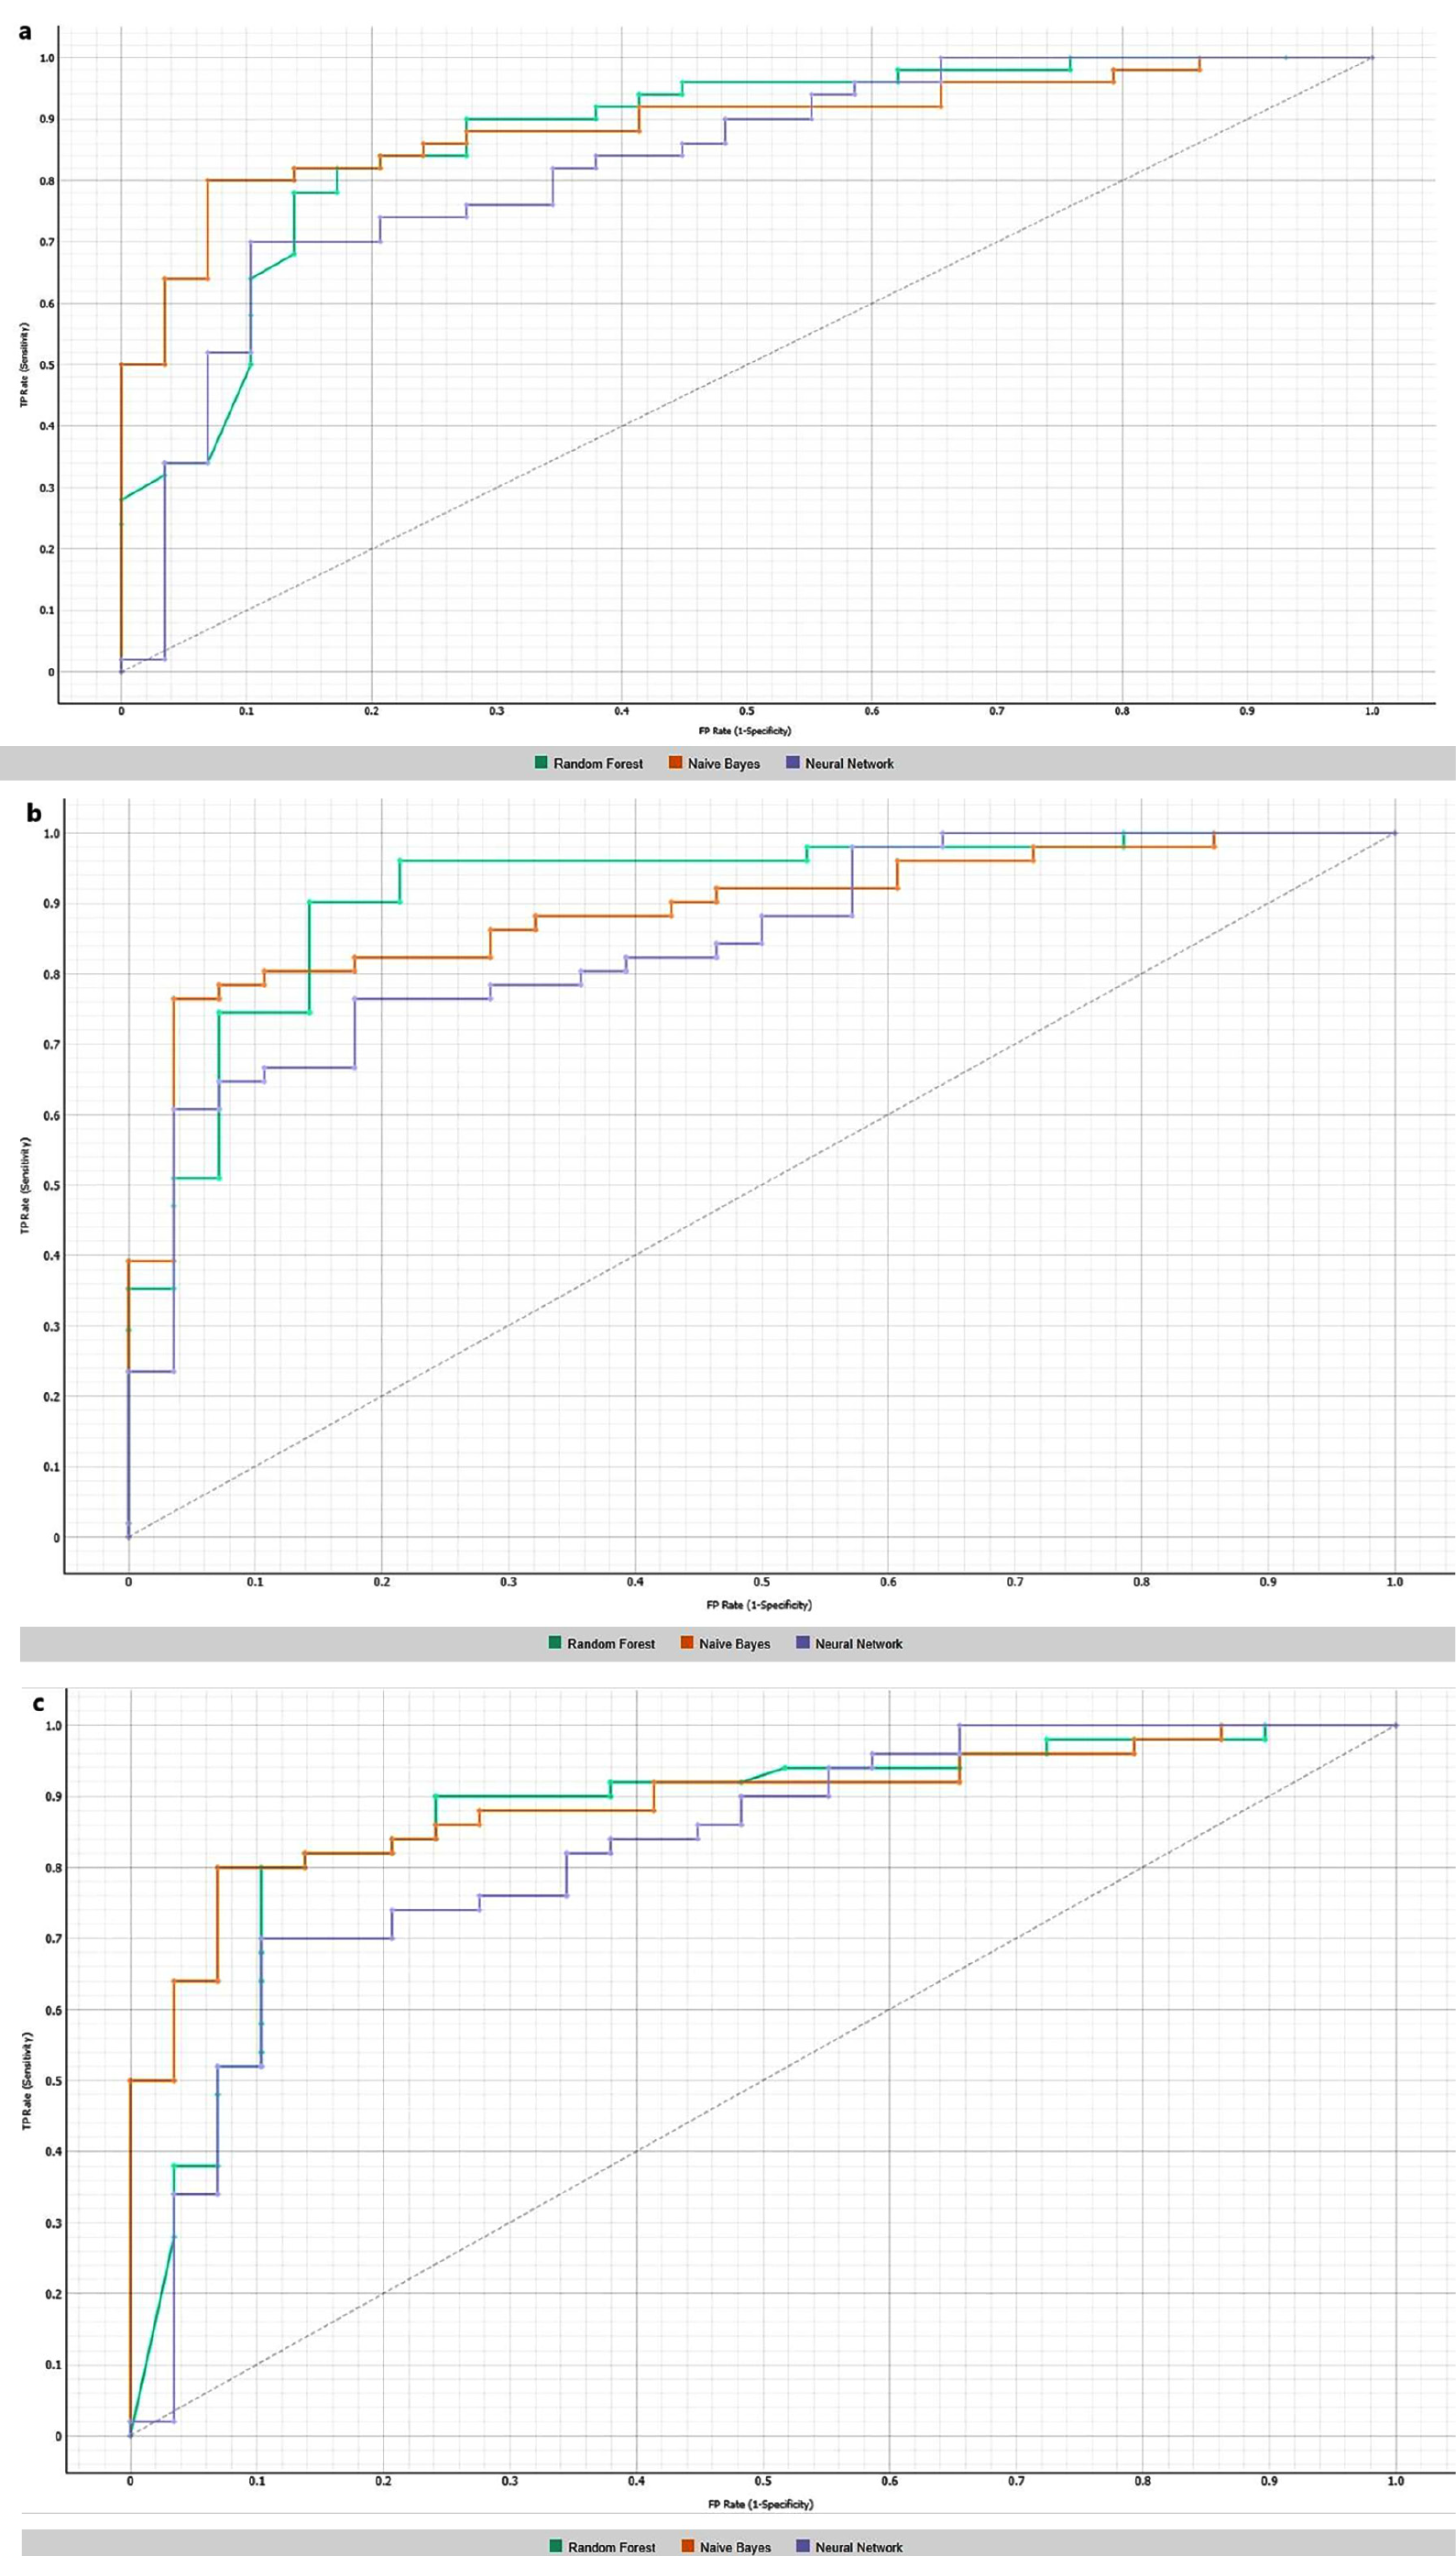
Table 5. Performance of different machine learning methods in predicting one-year progression in the testing set
- | Using texture features alone | Combining texture features with clinicopathological parameters | ||||||||||
Sensitivity (%) | Specificity (%) | PPV (%) | NPV (%) | AUC | Accuracy (%) | Sensitivity (%) | Specificity (%) | PPV (%) | NPV (%) | AUC | Accuracy (%) | |
Random forest | 90 | 69 | 84 | 55 | 0.739 | 90 | 90 | 69 | 83 | 80 | 0.923 | 83 |
Naive Bayes | 83 | 75 | 93 | 52 | 0.857 | 81 | 82 | 83 | 89 | 73 | 0.907 | 83 |
Neural network | 90 | 44 | 86 | 54 | 0.782 | 81 | 84 | 59 | 78 | 68 | 0.867 | 75 |
PPV: Positive predictive value; NPV: Negative predictive value; AUC: Area under the curve
Table 6. Performance of different machine learning methods in predicting three-year progression in the testing set
- | Using texture features alone | Combining texture features with clinicopathological parameters | ||||||||||
Sensitivity (%) | Specificity (%) | PPV (%) | NPV (%) | AUC | Accuracy (%) | Sensitivity (%) | Specificity (%) | PPV (%) | NPV (%) | AUC | Accuracy (%) | |
Random forest | 82 | 46 | 74 | 59 | 0.758 | 70 | 86 | 75 | 86 | 75 | 0.933 | 83 |
Naive Bayes | 78 | 61 | 78 | 61 | 0.804 | 72 | 80 | 82 | 89 | 70 | 0.917 | 81 |
Neural network | 82 | 64 | 81 | 67 | 0.828 | 76 | 80 | 61 | 79 | 63 | 0.898 | 73 |
PPV: Positive predictive value; NPV: Negative predictive value; AUC: Area under the curve
Table 7. Performance of different machine learning methods in predicting five-year progression in the testing set
- | Using texture features alone | Combining texture features with clinicopathological parameters | ||||||||||
Sensitivity (%) | Specificity (%) | PPV (%) | NPV (%) | AUC | Accuracy (%) | Sensitivity (%) | Specificity (%) | PPV (%) | NPV (%) | AUC | Accuracy (%) | |
Random forest | 78 | 62 | 78 | 62 | 0.797 | 72 | 90 | 69 | 83 | 80 | 0.870 | 82 |
Naive Bayes | 84 | 72 | 84 | 75 | 0.843 | 81 | 82 | 83 | 89 | 73 | 0.907 | 83 |
Neural network | 82 | 66 | 80 | 68 | 0.780 | 76 | 84 | 59 | 78 | 68 | 0.867 | 75 |
PPV: Positive predictive value; NPV: Negative predictive value; AUC: Area under the curve
Discussion and Conclusion
It is well established that conventional PET/CT parameters provide valuable prognostic information in breast cancer. Qu et al. () followed 125 patients with breast cancer for five years and demonstrated that higher SUVmax, metabolic tumor volume, and total lesion glycolysis values measured from the primary lesion were associated with increased rates of local recurrence and/or distant metastasis (). Similarly, in a meta-analysis, Diao et al. () reported that higher SUVmax values in the primary tumor were associated with an elevated risk of recurrence or progression but SUVmax had no significant effect on overall survival (OS).
PET/CT TA combined with ML has been used to predict PFS or OS in various malignancies (-). TA reflects tumor heterogeneity, which is influenced by multiple factors beyond a single tumor characteristic, including tumor microenvironment, grade, genetic profile, and immunohistochemical expression. Given that the smallest volumetric unit in imaging is a voxel, TA essentially analyzes how neighboring voxels relate to each other, which may reveal underlying prognostic features of the tumor. Nevertheless, despite its potential, TA is not yet widely adopted in routine clinical practice. Existing studies, most of which are retrospective, suggest that TA could help identify patients at high or low risk of recurrence or metastasis. However, results from prospective studies with standardized methodologies are still necessary. Previous research has also examined the relationship between PET/CT TA and survival in breast cancer (, , ), although most investigations have focused on the association between TA and histological or immunohistochemical parameters or on predicting the response to neoadjuvant therapy (, , ).
In the current study, we focused on the relationship between PET-derived TFs and PFS in patients with breast cancer. Among the 148 TFs listed in , many showed statistically significant differences between patients who achieved one-, three-, and five-year PFS and those who did not. ML models incorporating TFs and clinicopathological parameters successfully predicted one-, three-, and five-year PFS. Xu et al. () also attempted to predict PFS in breast cancer using TFs and clinical parameters and showed that the model combining TFs and clinical data outperformed models that used TFs or clinical variables alone. Importantly, their model remained successful in an external validation group. In our study, the addition of clinicopathological parameters to ML models similarly improved their predictive performance. Notably, model specificity increased, which significantly contributed to performance enhancement. However, we did not conduct external validation.
Yoon et al. () found that values above the threshold value for high-intensity zone emphasis and high-intensity short-zone emphasis among PET/CT-derived TFs were associated with shorter PFS in patients with LABC. However, that study did not investigate the effects of clinicopathological prognostic parameters or use ML, and it had a shorter median follow-up (17.3 months) than our study (112 weeks). In contrast, our study predicted PFS using both TFs alone and combined with clinicopathological parameters through ML.
In a prospective study investigating PET/CT-derived TFs in patients with LABC, TFs were associated with more aggressive tumor phenotypes. Cox regression analysis showed that certain features could predict longer DFS and OS (). However, this study, like Yoon et al. (), did not use ML or assess the effects of clinicopathological prognostic variables. In another study examining the relationship between PET/CT-derived TFs and clinicopathological parameters in patients with ER (+) and HER2 (-) breast cancer, high entropy values were linked to shorter event-free survival (). The authors evaluated the effects of only two TFs (entropy and homogeneity) on event-free survival and did not use ML. TFs offer a mathematical representation of tumor heterogeneity via imaging. Given that heterogeneity may result in treatment resistance or failure, TA could reasonably be expected to predict outcomes such as PFS, supported by both the previous study and the present one.
Zheng et al. () predicted DFS in patients who did not achieve pathological complete response after neoadjuvant chemotherapy by integrating clinical, radiomic, and deep learning features. Their combined model outperformed those based on single feature sets, with AUC values of 0.889 and 0.938 for three- and five-year DFS, respectively. Similarly, our study demonstrated that combining TFs with clinicopathological parameters improved the prediction of PFS compared to using either alone.
Classical prognostic factors in breast cancer, such as tumor size, axillary lymph node metastasis, tumor, node, and metastasis stage, histopathological subtype, and hormone receptor status, have long been validated in the literature (). Although our study primarily focused on imaging features, we observed that larger primary tumor size, presence of axillary and distant metastases, and ER (-) and PR (-) status were associated with disease progression.
Study Limitations
Our study has several limitations. First, it was a retrospective, single-center study with a relatively small sample size. This limited our ability to analyze specific subgroups, such as patients with a particular histopathological subtype or hormone receptor profile (e.g., triple-negative). Second, for technical reasons, patients with primary tumors having a metabolic volume of less than 64 voxels on PET were excluded; therefore, our findings may not be generalizable to tumors with a low metabolic volume. Third, the median follow-up period may have been insufficient, as breast cancer can recur even five to 10 years after treatment. Fourth, mammography and/or breast US were used to detect local recurrence during follow-up, with breast MRI reserved for equivocal cases. Lastly, the ML models were trained on 70% and tested on 30% of the data from the same patient cohort. While internal validation was performed, external datasets were not available for independent validation due to the single-center nature of the study.
ML models incorporating PET/CT-derived TFs and clinicopathological parameters may assist in predicting progression during the pre-treatment period in patients with invasive breast carcinoma. Predicting disease progression may allow clinicians to manage neoadjuvant and adjuvant treatment more effectively for patients who are at high risk of disease progression. If technical challenges, such as harmonizing PET/CT images from different centers and standardizing segmentation methods, can be resolved, TA may then be integrated into routine PET/CT workflows.
Footnotes
Ethics
Ethics Committee Approval: The Recep Tayyip Erdogan University Ethics Committee approved this study (approval no: 2022/228, date: 22.12.2022).
Informed Consent: The ethical committee waived the requirement for informed consent as the study was retrospective.
Authorship Contributions
Surgical and Medical Practices: O.B., H.M.B., S.G.; Concept: O.B., H.M.B., S.G.; Design: O.B., H.M.B., S.G.; Data Collection or Processing: O.B.; Analysis or Interpretation: O.B., H.M.B., S.G.; Literature Search: O.B., H.M.B., S.G.; Writing: O.B.
Conflict of Interest: No conflict of interest was declared by the authors.
Financial Disclosure: The authors declared that this study received no financial support.
References
Łukasiewicz S, Czeczelewski M, Forma A, Baj J, Sitarz R, Stanisławek A. Breast cancer-epidemiology, risk factors, classification, prognostic markers, and current treatment strategies-an updated review. Cancers (Basel). 2021; 13: 4287. (PMID: 34503097)
Endo K, Oriuchi N, Higuchi T, Iida Y, Hanaoka H, Miyakubo M, et al. PET and PET/CT using 18F-FDG in the diagnosis and management of cancer patients. Int J Clin Oncol. 2006; 11: 286-296. (PMID: 16937302)
Groheux D, Cochet A, Humbert O, Alberini JL, Hindié E, Mankoff D. ¹⁸F-FDG PET/CT for staging and restaging of breast cancer. J Nucl Med. 2016; 57(Suppl 1): 17S-26S. (PMID: 26834096)
Çelik B, Boge M, Dilege E. Does F-18 FDG-PET/CT have an additional impact on axillary approach in early-stage breast cancer? Eur J Breast Health. 2023; 20: 45-51. (PMID: 38187104)
Aktaş A, Gürleyik MG, Aydın Aksu S, Aker F, Güngör S. Diagnostic value of axillary ultrasound, MRI, and 18F-FDG-PET/ CT in determining axillary lymph node status in breast cancer patients. Eur J Breast Health. 2021; 18: 37-47. (PMID: 35059590)
Qu YH, Long N, Ran C, Sun J. The correlation of 18F-FDG PET/CT metabolic parameters, clinicopathological factors, and prognosis in breast cancer. Clin Transl Oncol. 2021; 23: 620-627. (PMID: 32683540)
Lambin P, Leijenaar RTH, Deist TM, Peerlings J, de Jong EEC, van Timmeren J, et al. Radiomics: the bridge between medical imaging and personalized medicine. Nat Rev Clin Oncol. 2017; 14: 749-762. (PMID: 28975929)
Chicklore S, Goh V, Siddique M, Roy A, Marsden PK, Cook GJ. Quantifying tumour heterogeneity in 18F-FDG PET/CT imaging by texture analysis. Eur J Nucl Med Mol Imaging. 2013; 40: 133-140. (PMID: 23064544)
Sollini M, Cozzi L, Ninatti G, Antunovic L, Cavinato L, Chiti A, et al. PET/CT radiomics in breast cancer: mind the step. Methods. 2021; 188: 122-132. (PMID: 31978538)
Molina-García D, García-Vicente AM, Pérez-Beteta J, Amo-Salas M, Martínez-González A, Tello-Galán MJ, et al. Intratumoral heterogeneity in 18F-FDG PET/CT by textural analysis in breast cancer as a predictive and prognostic subrogate. Ann Nucl Med. 2018; 32: 379-388. (PMID: 29869770)
Li P, Wang X, Xu C, Liu C, Zheng C, Fulham MJ, et al. 18F-FDG PET/CT radiomic predictors of pathologic complete response (pCR) to neoadjuvant chemotherapy in breast cancer patients. Eur J Nucl Med Mol Imaging. 2020; 47: 1116-1126. (PMID: 31982990)
Bouron C, Mathie C, Seegers V, Morel O, Jézéquel P, Lasla H, et al. Prognostic value of metabolic, volumetric and textural parameters of baseline [18F]FDG PET/CT in early triple-negative breast cancer. Cancers (Basel). 2022; 14: 637. (PMID: 35158904)
Nioche C, Orlhac F, Boughdad S, Reuzé S, Goya-Outi J, Robert C, et al. LIFEx: a freeware for radiomic feature calculation in multimodality imaging to accelerate advances in the characterization of tumor heterogeneity. Cancer Res. 2018; 78: 4786-4789. (PMID: 29959149)
Wahl RL, Jacene H, Kasamon Y, Lodge MA. From RECIST to PERCIST: evolving considerations for PET response criteria in solid tumors. J Nucl Med. 2009; 50(Suppl 1): 122S-150S. (PMID: 19403881)
Tibshiranit R. Regression shrinkage and selection via the lasso. J R Statist Soc B. 1996;58:267-288.
Aebi S, Karlsson P, Wapnir IL. Locally advanced breast cancer. Breast. 2022; 62(Suppl 1): S58-S62. (PMID: 34930650)
Diao W, Tian F, Jia Z. The prognostic value of SUVmax measuring on primary lesion and ALN by 18F-FDG PET or PET/CT in patients with breast cancer. Eur J Radiol. 2018; 105:1-7. (PMID: 30017264)
Hotta M, Minamimoto R, Gohda Y, Miwa K, Otani K, Kiyomatsu T, et al. Prognostic value of 18F-FDG PET/CT with texture analysis in patients with rectal cancer treated by surgery. Ann Nucl Med. 2021; 35: 843-852. (PMID: 33948903)
Marr L, Haller B, Pyka T, Peeken JC, Jesinghaus M, Scheidhauer, et al. Predictive value of clinical and 18F-FDG-PET/CT derived imaging parameters in patients undergoing neoadjuvant chemoradiation for esophageal squamous cell carcinoma. Sci Rep 2022; 12: 1-9.
Morvan L, Carlier T, Jamet B, Bailly C, Bodet-Milin C, Moreau P, et al. Leveraging RSF and PET images for prognosis of multiple myeloma at diagnosis. Int J Comput Assist Radiol Surg. 2020; 15:129-139. (PMID: 31256359)
Liu W, Sun X, Qi Y, Jia X, Huang Y, Liu N, et al. Integrated texture parameter of 18F-FDG PET may be a stratification factor for the survival of nonoperative patients with locally advanced non-small-cell lung cancer. Nucl Med Commun. 2018; 39: 732-740. (PMID: 30001264)
Yoon HJ, Kim Y, Chung J, Kim BS. Predicting neo-adjuvant chemotherapy response and progression-free survival of locally advanced breast cancer using textural features of intratumoral heterogeneity on F-18 FDG PET/CT and diffusion-weighted MR imaging. Breast J. 2019; 25: 373-380. (PMID: 29602210)
Groheux D, Martineau A, Teixeira L, Espié M, de Cremoux P, Bertheau P, et al. 18FDG-PET/CT for predicting the outcome in ER+/HER2- breast cancer patients: comparison of clinicopathological parameters and PET image-derived indices including tumor texture analysis. Breast Cancer Res. 2017; 19:3. (PMID: 28057031)
Moscoso A, Ruibal Á, Domínguez-Prado I, Fernández-Ferreiro A, Herranz M, Albaina L, et al. Texture analysis of high-resolution dedicated breast 18 F-FDG PET images correlates with immunohistochemical factors and subtype of breast cancer. Eur J Nucl Med Mol Imaging. 2018; 45: 196-206. (PMID: 28936601)
Xu X, Sun X, Ma L, Zhang H, Ji W, Xia X, et al. 18F-FDG PET/CT radiomics signature and clinical parameters predict progression-free survival in breast cancer patients: a preliminary study. Front Oncol. 2023; 13: 1149791. (PMID: 36969043)
Zheng X, Huang Y, Lin Y, Zhu T, Zou J, Wang S, et al. 18F-FDG PET/CT-based deep learning radiomics predicts 5-years disease-free survival after failure to achieve pathologic complete response to neoadjuvant chemotherapy in breast cancer. EJNMMI Res. 2023; 13: 105. (PMID: 38052965)
Subramaniam DS, Isaacs C. Utilizing prognostic and predictive factors in breast cancer. Curr Treat Options Oncol. 2005; 6: 147-159. (PMID: 15717996)
Supplementary Materials
Supplementary Table 1. First order and second order PET texture features that extracted from the three-dimensional range of interest
First order texture features | Name of the texture feature |
|---|---|
Morphological | Volume, approximate volume, voxels counting, surface area, surface to volume ratio, compacity, compactness 1, compactness 2, spherical disproportion, sphericity, aspehicirty, max value coordinates, center of mass, weighted center of mass, hoc max, hoc max normalized with radius ROI, hoc max normalized with radius sphere, hocpeak 0.5 mL, hocpeak 0.5 mL normalized with radius ROI, hocpeak 0.5 mL normalized with radius sphere, hocpeak 1 mL, hocpeak 1 mL normalized with radius ROI, hocpeak 1 mL normalized with radius sphere, centre of mass shift, centre of mass shiftmax normalized with radius ROI, centre of mass shiftmax normalized with radius sphere, maximum 3d diameter, sphere diameter, integrated intensity. |
Intensity-based | Mean, variance, skewness, kurtosis, median, minimum gray level, 10th percentile, 25th percentile, 50th percentile, 75th percentile, 90th percentile, standard deviation, maximum grey level, interquartile range, range, mean absolute deviation, robust mean absolute deviation, median absolute deviation, coefficient of variation, quartile coefficient of dispersion, are under curve csh, energy, root mean square, total lesion glycolisis, |
Local intensity-based | Intensity peak discretized volume sought (0.5 mL), global intensity peak (0.5 mL), intensity peak discretized volume sought (1 mL), global intensity peak (1 mL), local intensity peak. |
Intensity-histogram | Intensity histogram mean, intensity histogram variance, intensity histogram skewness, intensity histogram kurtosis, intensity histogram median, intensity histogram minimum grey level, intensity histogram 10th percentile, intensity histogram 25th percentile, intensity histogram 50th percentile, intensity histogram 75th percentile, intensity histogram 90th percentile, intensity histogram standard deviation, intensity histogram maximum grey level, intensity histogram mode, intensity histogram interquartile range, intensity histogram range, intensity histogram mean absolute deviation, intensity histogram robust mean absolute deviation, intensity histogram median absolute deviation, intensity histogram coefficien of variation, intensity histogram quartile coefficien dispersion, intensity histogram entropy log10, intensity histogram entropy log2, area under curve csh, uniformity, root mean square, maximum histogram gradient, maximum histogram gradient grey level, minimum histogram gradient, minimum histogram gradient grey level. |
Local intensity histogram | Intensity peak discretized volume sought (0.5 mL), global intensity peak (0.5 mL), intensity peak discretized volume sought (1 mL), global intensity peak (1 mL), local intensity peak. |
Second order texture features | |
Intensity-based rim | Min, mean, stdev, max, counting voxels, approximate volume, sum. |
Intensity histogram rim | Min, mean, stdev, max, counting voxels, approximate volume, sum. |
Gray-level co-occurrence matrix (GLCM) | Joint maximum, joint average, joint variance, joint entropy log2, joint entropy log10, difference average, difference variance, difference entropy, sum average, sum variance, sum entropy, angular second moment, contrast, dissimilarity, inverse difference, normalized inverse difference, inverse difference moment, normalized inverse difference moment, inverse variance, correlation, autocorrelation, cluster tendency, sluster shade, cluster prominence. |
Neighboring gray tone difference matrix (NGTDM) | Coarseness, contrast, busyness, complexity, strength. |
Gray-level run-length matrix (GLRM) | Short runs emphasis, long runs emphasis, low grey level run emphasis, high grey level run emphasis, short run low grey level emphasis, short run high grey level emphasis, long run low grey level emphasis, long run high grey level emphasis, grey level nonuniformity, run length nonuniformity, run percentage. |
Gray-level size zone matrix (GLSZM) | Small zone emphasis, large zone emphasis, low grey level zone emphasis, high grey level zone emphasis, small zone low grey level emphasis, small zone high grey level emphasis, large zone low grey level emphasis, large zone high grey level emphasis. |
PET: Positron emission tomography; ROI: Region of interest